
Research Areas
Tax Compliance
Covid Policy
Income Inequality
Tax Progressivity
Income Mobility
Tax Credits/Policy
Health/Pensions
Curriculum Vitae
Google Scholar
Ideas/Repec
Guillain-Barre Recovery

New
"Reply to Dube (2026): The Debate on U.S. Income Inequality." Working paper, 2026.
[Abstract]
This paper replies to Dube (2026), who reviews the debate over U.S. income inequality estimates from Piketty-Saez-Zucman and Auten-Splinter. It clarifies the inconsistency of the CBO income series, the allocation of underreported income and excess depreciation, wage inequality trends, and the treatment of deficits, government consumption, and sales taxes. Several claims in Dube's review mischaracterize the Auten-Splinter approach or misdiagnose the sources of disagreement. The review also ignores the main factors lowering inequality relative to tax-reported income: the growth of untaxed employee compensation, transfers, and tax progressivity. The Auten-Splinter findings remain robust: after-tax top income shares show limited long-run growth.
"Comment: Income Inequality and Campaign Contributions: Evidence from the 1986 Reagan Tax Cut." Working paper, 2026.
[Abstract]
This paper comments on a study by Larcinese and Parmigiani (2026) suggesting that the Tax Reform Act of 1986 disproportionately increased high-income campaign contributions in the United States. Their treatment measure implies large aggregate tax decreases, even though real federal individual income-tax receipts and total federal tax receipts increased. This sign error results from applying statutory marginal tax-rate changes to market income while ignoring tax-base changes and differences between market and taxable income. This comment also argues that real campaign contributions did not surge after the reform, that TRA86 increased measured tax progressivity, and that campaign-contribution patterns following later high-income tax increases contradict the proposed mechanism.
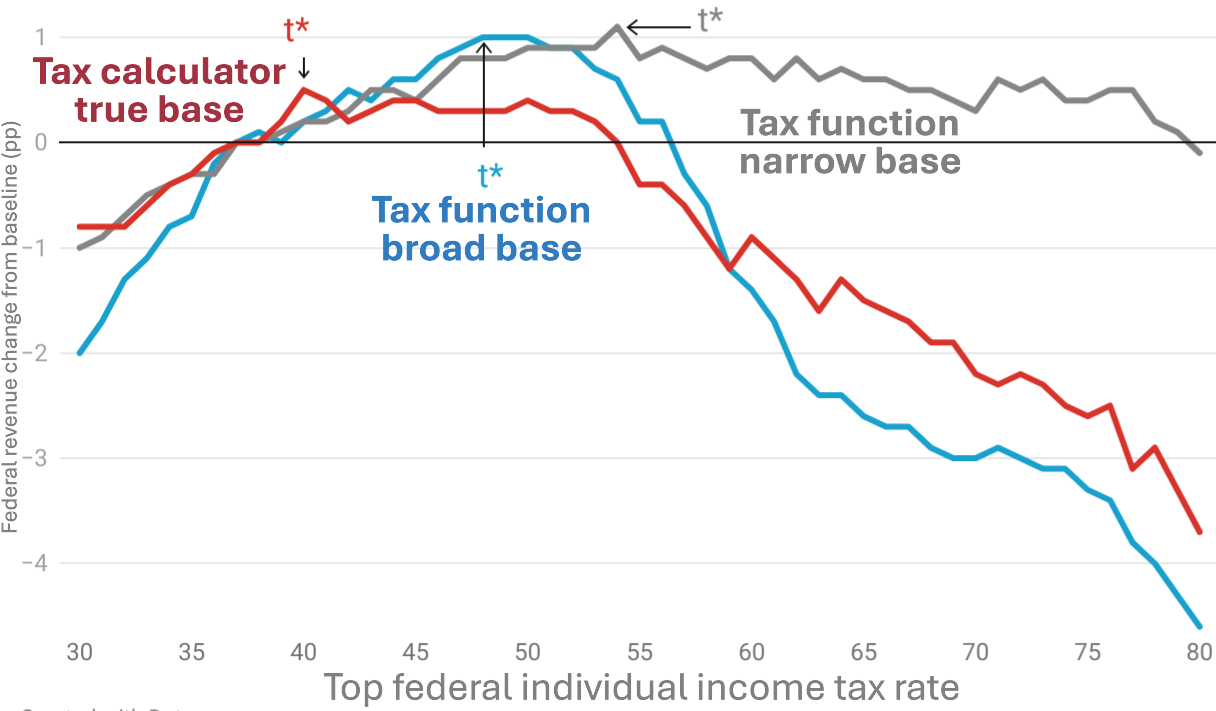
"Is the Laffer Curve Flat?"
with Rachel Moore and Brandon Pecoraro. Working paper, 2026. (Summary, Appendix)
Media: WaPo, BPC, a summary
[Abstract]
The Laffer curve peaks at the revenue-maximizing top tax rate, where revenue losses from behavioral responses offset revenue gains from a higher tax rate. Prior studies, however, largely overlook the Laffer curve's shape, rely on simplified tax functions, and often omit shifting across business types and tax interactions. We show that modeling distinct tax bases more accurately and incorporating these interactions lowers the revenue-maximizing top tax rate and the associated revenue gains, yielding "flat" Laffer curves. Over this flat region, increasing the top tax rate raises relatively little revenue. Instead, raising top rates primarily trades off between progressivity and growth.
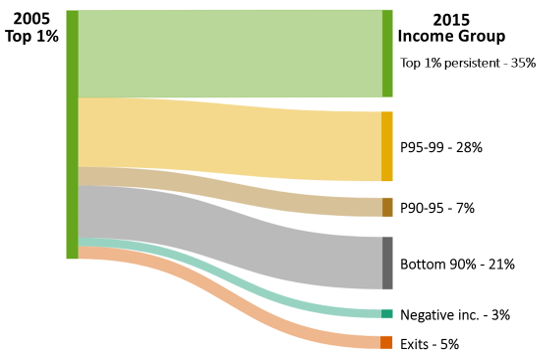
"Income Mobility of the Top One Percent."
with Jeff Larrimore. Working paper, 2026. (Summary, Appendix, FedRes wp, Excel file)
[Abstract]
Circulation into and out of the top one percent is pronounced in the U.S. One third exit after a year and two-thirds exit after a decade. This mobility lowers top income shares when shifting from annual to multi-year income measures. Intragenerational mobility over two decades lowers recent top one percent fiscal income shares by over 10 percent. Two-decade mobility reduces top 0.1% shares by over 20 percent, top 0.01% shares by 30 percent, and top 0.001% shares by 40 percent. Effects of variability on wealth inequality are similar in magnitude, although more modest as a share of top wealth inequality.
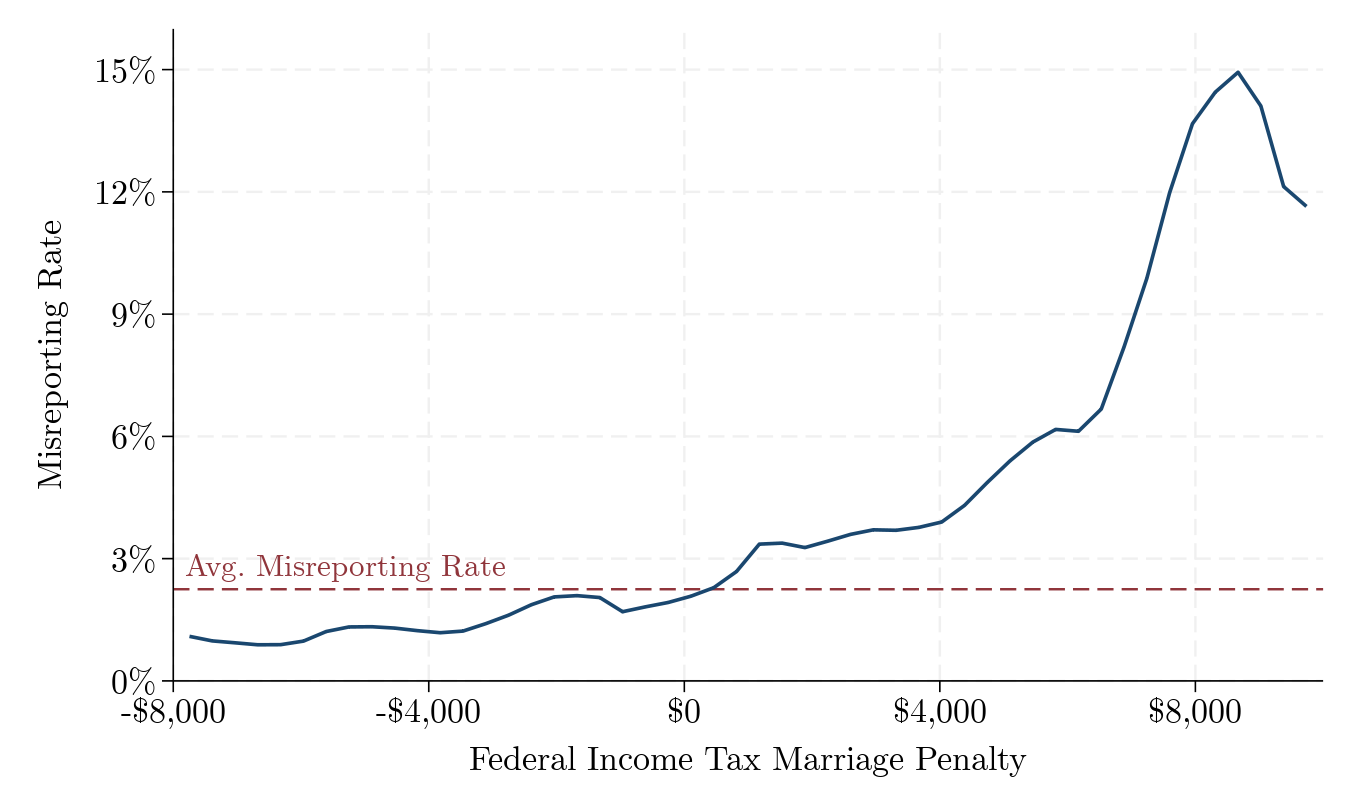
"Do Marriage Penalties Cause Delayed Marriage Reporting?"
with William Gorman. Working paper, 2025. (summary, appendix)
[Abstract]
Couples can face higher taxes when filing as married rather than unmarried. These marriage penalties may motivate newlyweds to delay reporting their marriage on U.S. tax returns. Linking marriage records to federal tax returns, we show marriage penalties are correlated with delayed marriage reporting. Over 2% of newlyweds misreport their marital status. Misreporting rates increase to 14% when marriage penalties reach $8,000. Misreporting and large marriage penalties are more prevalent among couples with similar earnings and claiming Earned Income Tax Credits. Misreporting couples respond to incentive changes, often correcting their filing status when marriage penalties become bonuses.
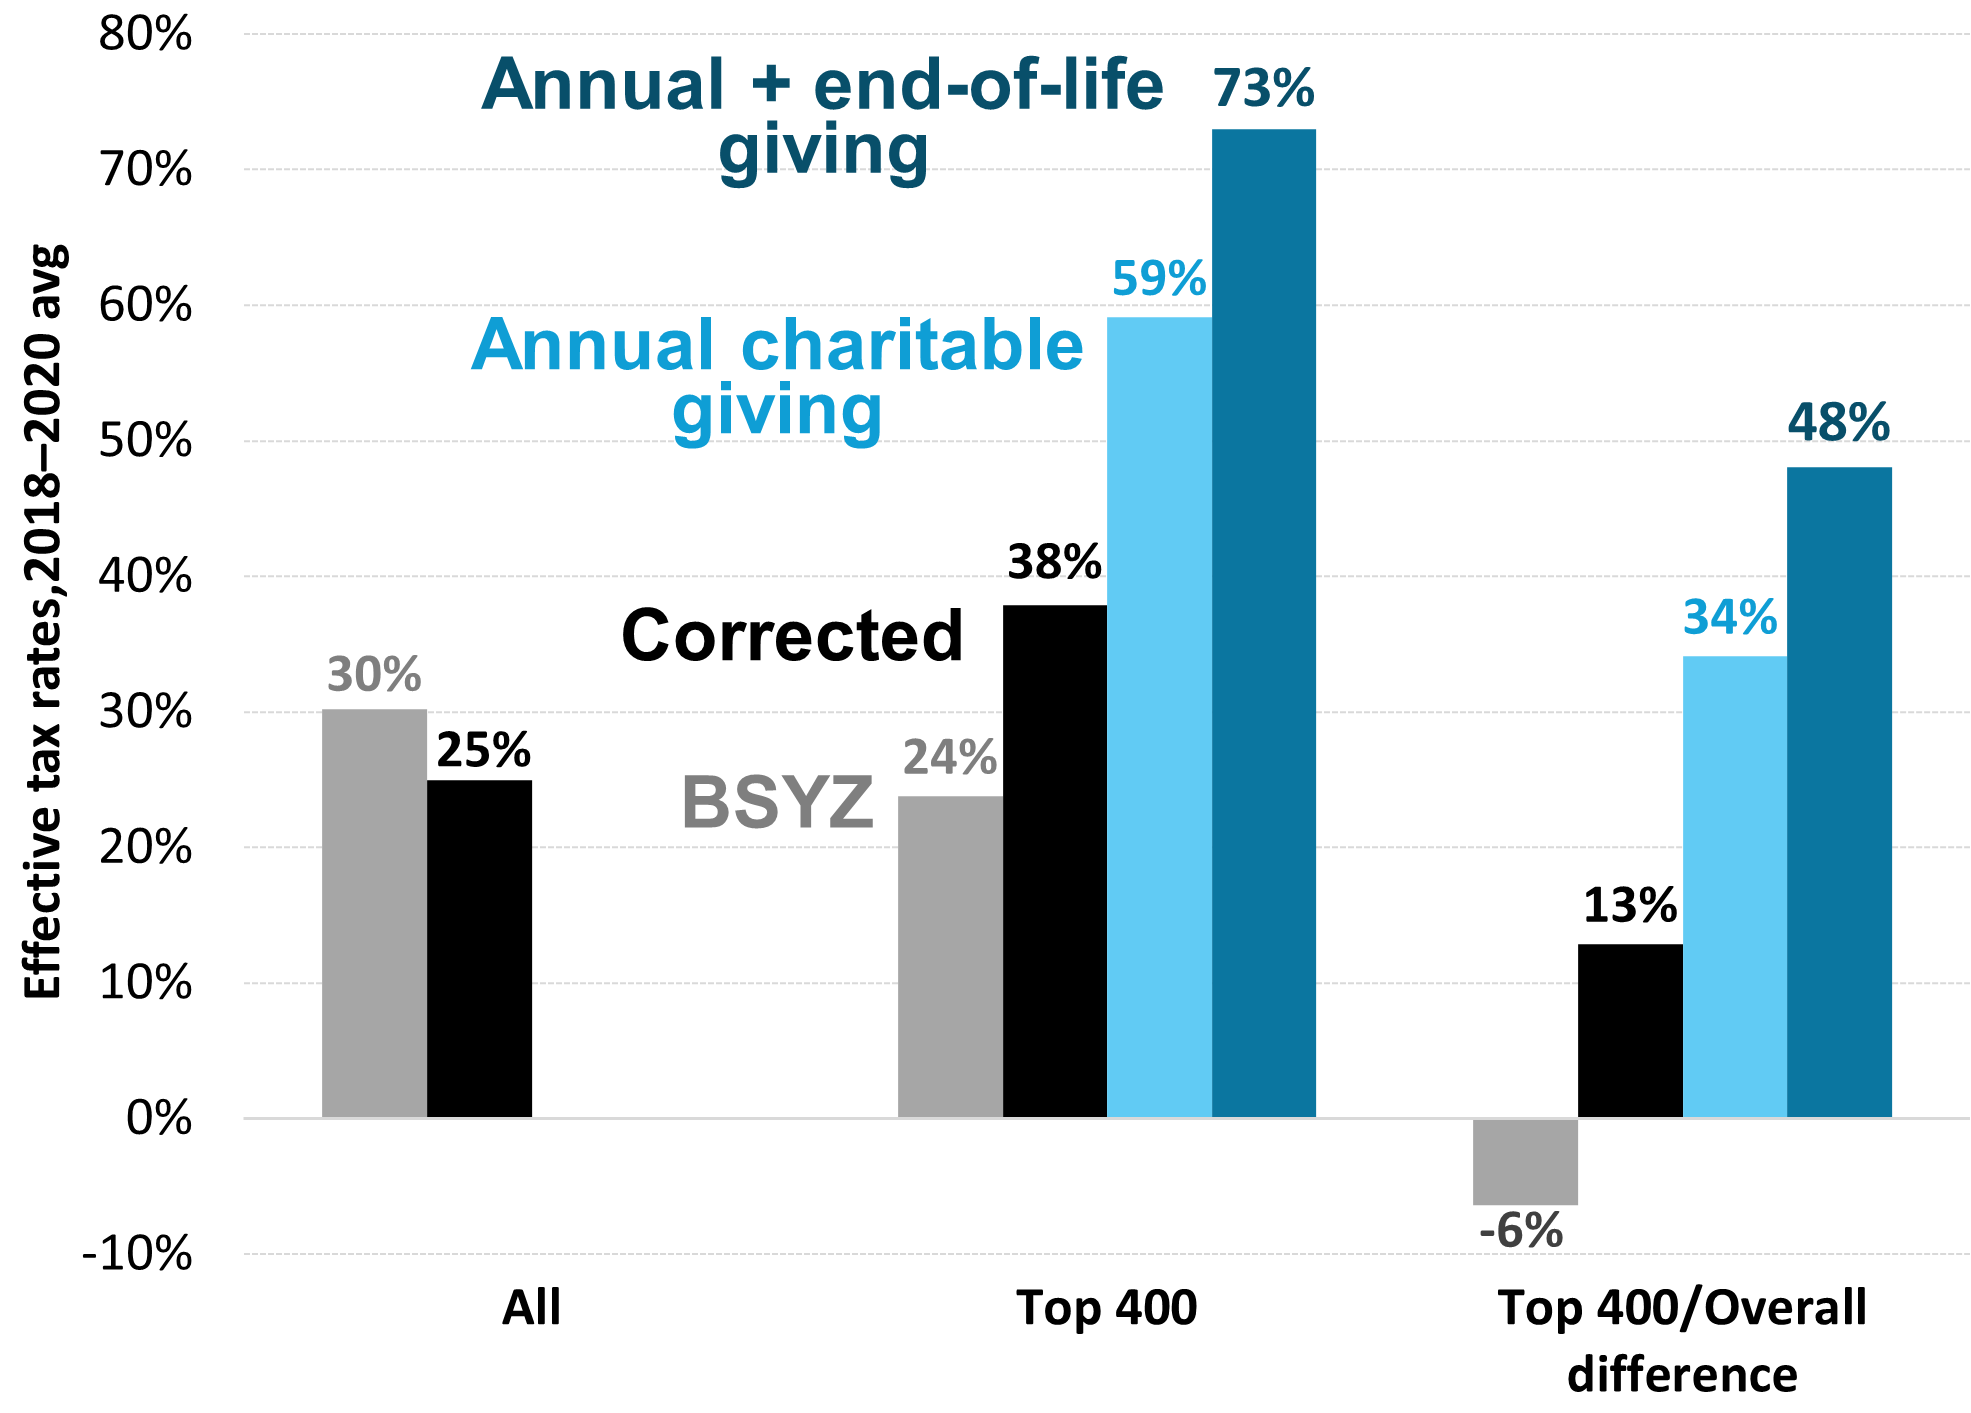
"Comment on "How Much Tax Do Billionaires Pay?" Working paper, 2025. (pdf version)
Media: Economist-june, Economist-feb, MR, Barron's, Tax Found., CATO
[Abstract]
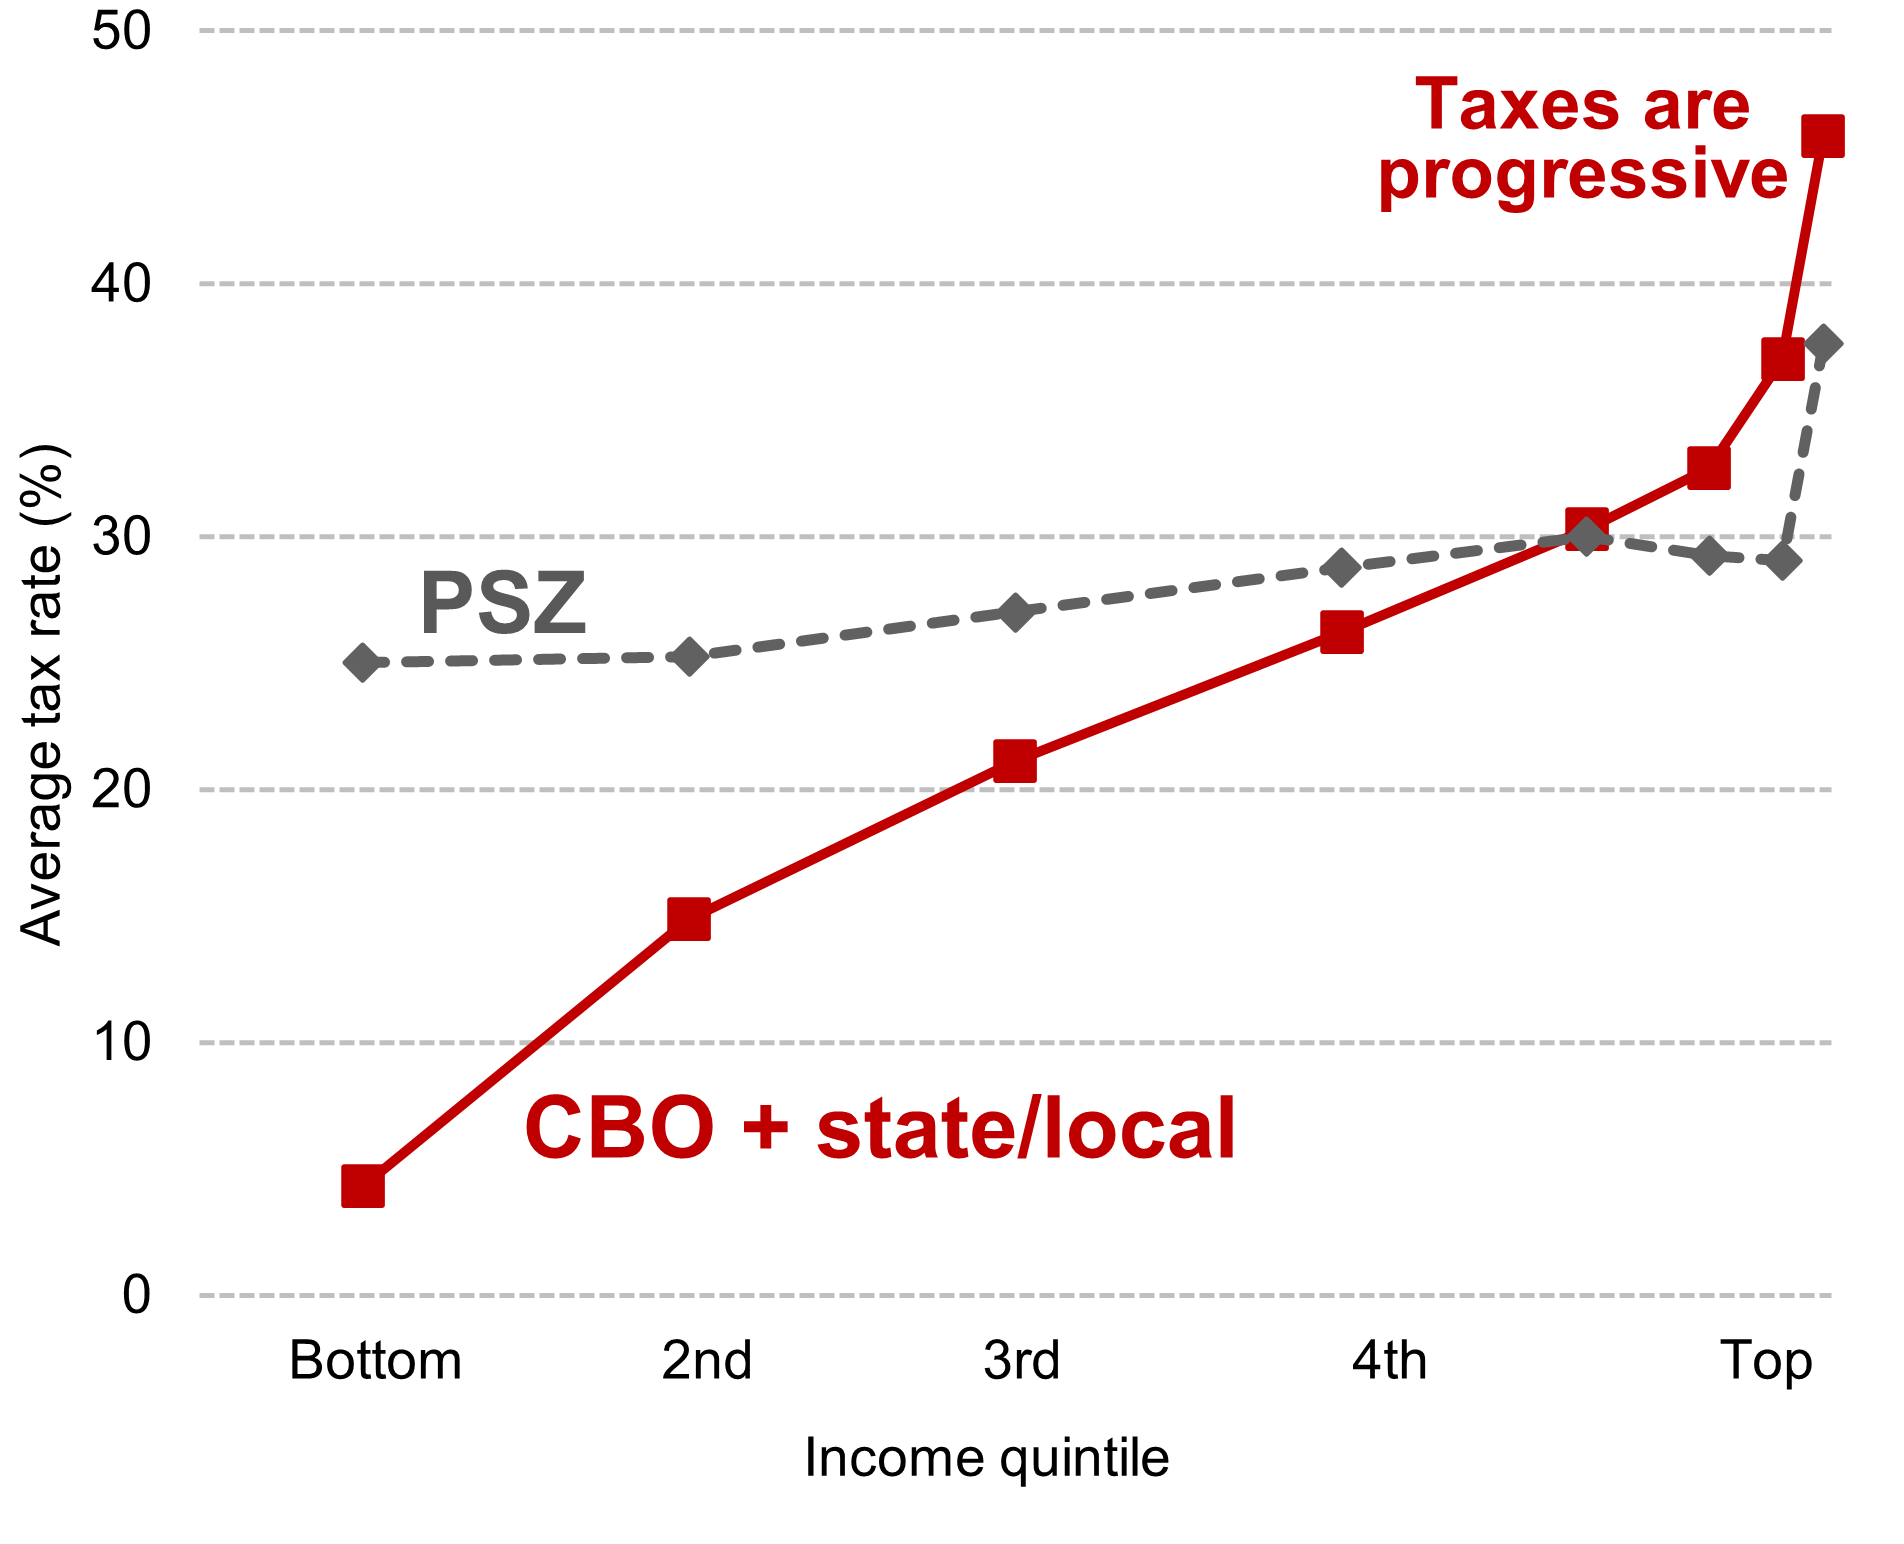
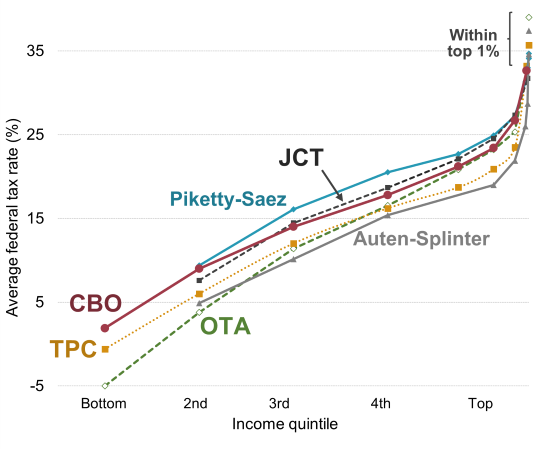
The U.S. tax system is highly progressive. Effective tax rates increase from 2% for the bottom quintile of income to 45% for the top hundredth of one percent. But rates may be lower among those with the highest wealth. This comment starts with the "top 400" tax rate estimates by wealth in Balkir, Saez, Yagan, and Zucman (2025 BSYZ), and adjusts these to account for Forbes family wealth being spread across multiple tax returns, to avoid double-counting capital income, to include missing taxes, and to apply standard tax and income definitions. This results in "top 400" effective tax rates exceeding overall tax rates by 13 percentage points. Still, the "top 400" tax rate is lower than for the top hundredth of one percent, suggesting a modest decline in effective tax rates at the very top when ranking by wealth. However, this is an unsurprising deviation from progressive rates because the tax system targets income, not wealth. Compared to the annual estimates in BSYZ, longer-run estimates are more appropriate for top wealth groups, which have volatile wealth and concentrate charitable giving into end-of-life bequests. End-of-life giving suggests long-run top 400 effective tax-and-giving rates could exceed 75%.
"Who Evades Taxes? The Distribution of the U.S. Tax Gap."
with William Gorman and Jamie McGuire. 2025. For Proceedings of the 15th Annual IRS-TPC Research Conference on Tax Administration. (Slides, presentation at 5:28)
[Abstract]
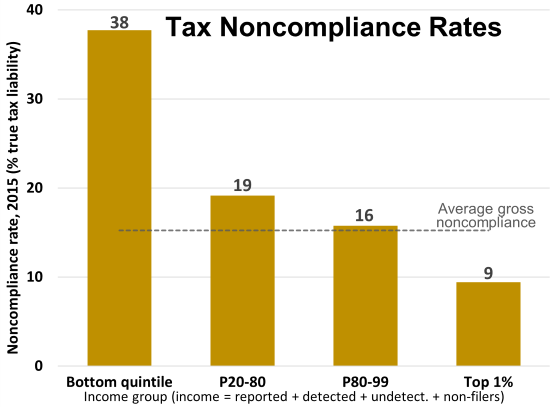
Tax gaps measure underpaid taxes. This study provides a comprehensive analysis of the tax gap over the income distribution, accounting for the full tax gap and various years. Using random audit studies and certain IRS assumptions, we show that tax noncompliance rates are highest among those with the lowest incomes. This result is robust to different assumptions. Tax noncompliance rates are four times higher for the bottom quintile than for the top 1% of the income distribution. This divergence increased over time—the bottom-quintile has become less compliant and the top 1% more compliant.
"Double-Claimed Dependents: Did E-Filing Lower U.S. Tax Noncompliance?"
with William Gorman and Jamie McGuire. International Tax and Public Finance, 2025, https://doi.org/10.1007/s10797-025-09926-4. (Excel file)
[Abstract]
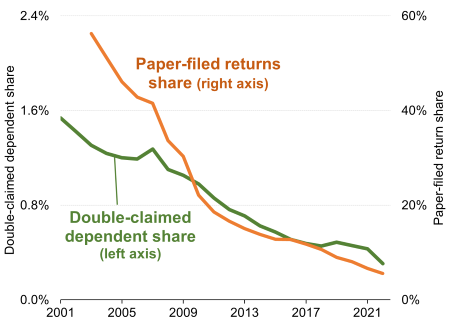
Children should only be claimed on a single tax return, but some are claimed on two returns, or double-claimed. While many countries use child registries to prevent double-claiming, the United States tax authority does not. As a result, in 2001 the U.S. had over one million double-claimed dependents. Despite increasing child tax benefit values, the number of double-claimed dependents in the U.S. decreased by 80 percent over the last two decades.
This paper documents this decrease and suggests it partly resulted from an increase in electronically filed returns, as double-claiming causes automatic e-file rejections. The decrease in double-claimed dependents avoids over 50,000 annual audits and reduces annual tax credit payments by about $3 billion. Our findings suggest e-filing may have helped lower tax noncompliance more broadly over this period, as the IRS also rejects e-filed returns for many other reasons. Additionally, double-claiming illustrates a consequence of tax complexity, as dependent-claiming rules are often not straightforward. This analysis is also timely. There have been two recent proposals for U.S. child registries, and the IRS just reversed its longstanding policy to now allow e-filed double-claiming.
"The Distribution of Capital Gains in the United States: A Comment"
Working paper, 2025.
[Abstract]
National income is estimated based on a consistent treatment of economic income flows. Research on the distribution of income (Piketty, Saez, and Zucman 2018; Auten and Splinter 2024) uses these agreed upon national income concepts. Notably, national income excludes accrued capital gains, as income is only generated by an underlying asset when it contributes to current-year production. Capital gains, in contrast, are based on volatile asset-price changes and are not meaningful measures of economic income. Adding capital gains to national income breaks the consistent approach to income measurement, shifts capital income forward in time, and exaggerates top income shares. This comment reviews the Campbell, Robbins, and Wylde (2024) approach of incorporating capital gains into national income, challenging their analysis, conclusions, and contributions to the literature.
"The Paycheck Protection Program: Progressivity and Tax Effects."
with Eric Heiser, Michael Love, and Jacob Mortenson.
National Tax Journal, 2026, 79(2), 409-429. ( NTJ link, Excel file, Appendix Working paper)
[Abstract]
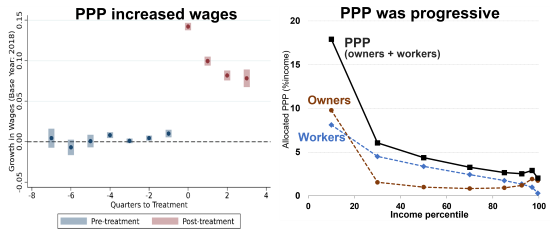
The $800 billion Paycheck Protection Program (PPP) provided pandemic relief to businesses retaining employees. Prior research has not directly estimated the PPP's distributional or tax effects. Linking PPP loans to tax records, we estimate progressive effects with respect to income for both workers and business owners. Bottom-quintile incomes increased 18 percent and top-quintile incomes increased 2 percent. About half of PPP relief benefitted workers. The PPP also increased taxes and decreased unemployment compensation, reducing net program costs by one-quarter. Net costs could have been even lower (and progressivity higher) without the tax exclusion of PPP forgiveness.
"Advance Tax Credits: Reconciliations and Repayments."
with James Elwell and Lin Xu. National Tax Journal, 2026, 79(1): 73-106. (Excel file)
[Abstract]
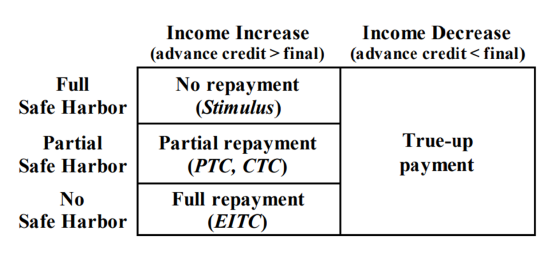
Advance tax credits may require recipients to repay excess amounts. Policymakers have limited information about these repayments, their distributional impact, or the cost of repayment protections. We estimate these using tax data across four advance credits: health insurance premium tax credits, child tax credits, earned income tax credits, and stimulus checks. Advance credit repayments usually result from income increases across credit phase outs. Credits targeting lower-income families have phase outs affecting many people with income increases, resulting in higher repayment rates. We discuss how advancing credits can contribute to noncompliance and introduce an approach to evaluate advance tax credit proposals.
"Income Inequality in the United States: Extensions and Updates"
with Gerald Auten. Working paper, 2025. (Excel file)
Media: Economist
[Abstract]
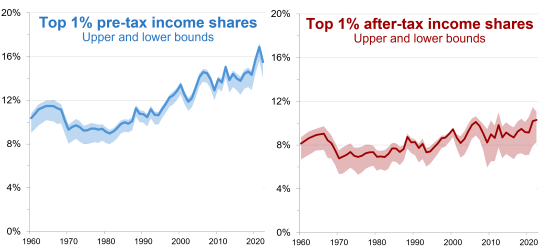
Auten and Splinter (2024) estimated national income inequality using tax data. This paper extends these estimates to cover the years 2020 to 2022. During the pandemic, fiscal relief offset all the increase in distribution-wide inequality and most of the increase in top 1% income shares. Once pandemic-era relief ended in 2022, however, after-tax income inequality increased. In addition, this paper incorporates several improved methods and uses recently revised national accounts data. Collectively, these updates have only modest effects on top income shares. Finally, sensitivity tests show a narrow range around our baseline top income shares (see figure below). Top income shares declined in the late 1960s and increased in the late 1980s and 1990s with little net change. From 1962 to 2019, top 1% after-tax income shares increased only up to one percentage point. Since 2019, both pre-tax and after-tax top 1% shares increased another percentage point.
"Income Inequality in the United States: Using Tax Data to Measure Long-term Trends."
with Gerald Auten. Journal of Political Economy, 2024, 132(7), 2179-2227.
Reply to Dube (2026)
Reply to Piketty, Saez, and Zucman (2024)
Reply to Iselin and Reck (2024)
Reply to Brookings (2023)
Prior responses to Piketty, Saez, and Zucman: 2019, 2020, 2023, our supplementary appendix and online appendix
[Abstract]
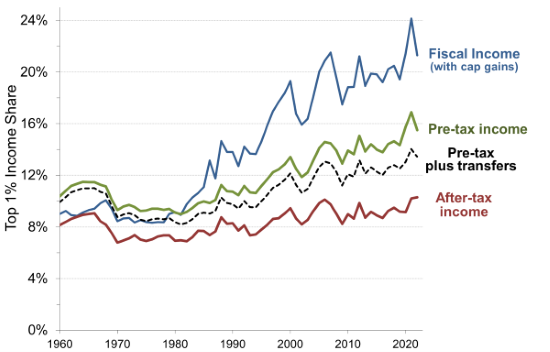
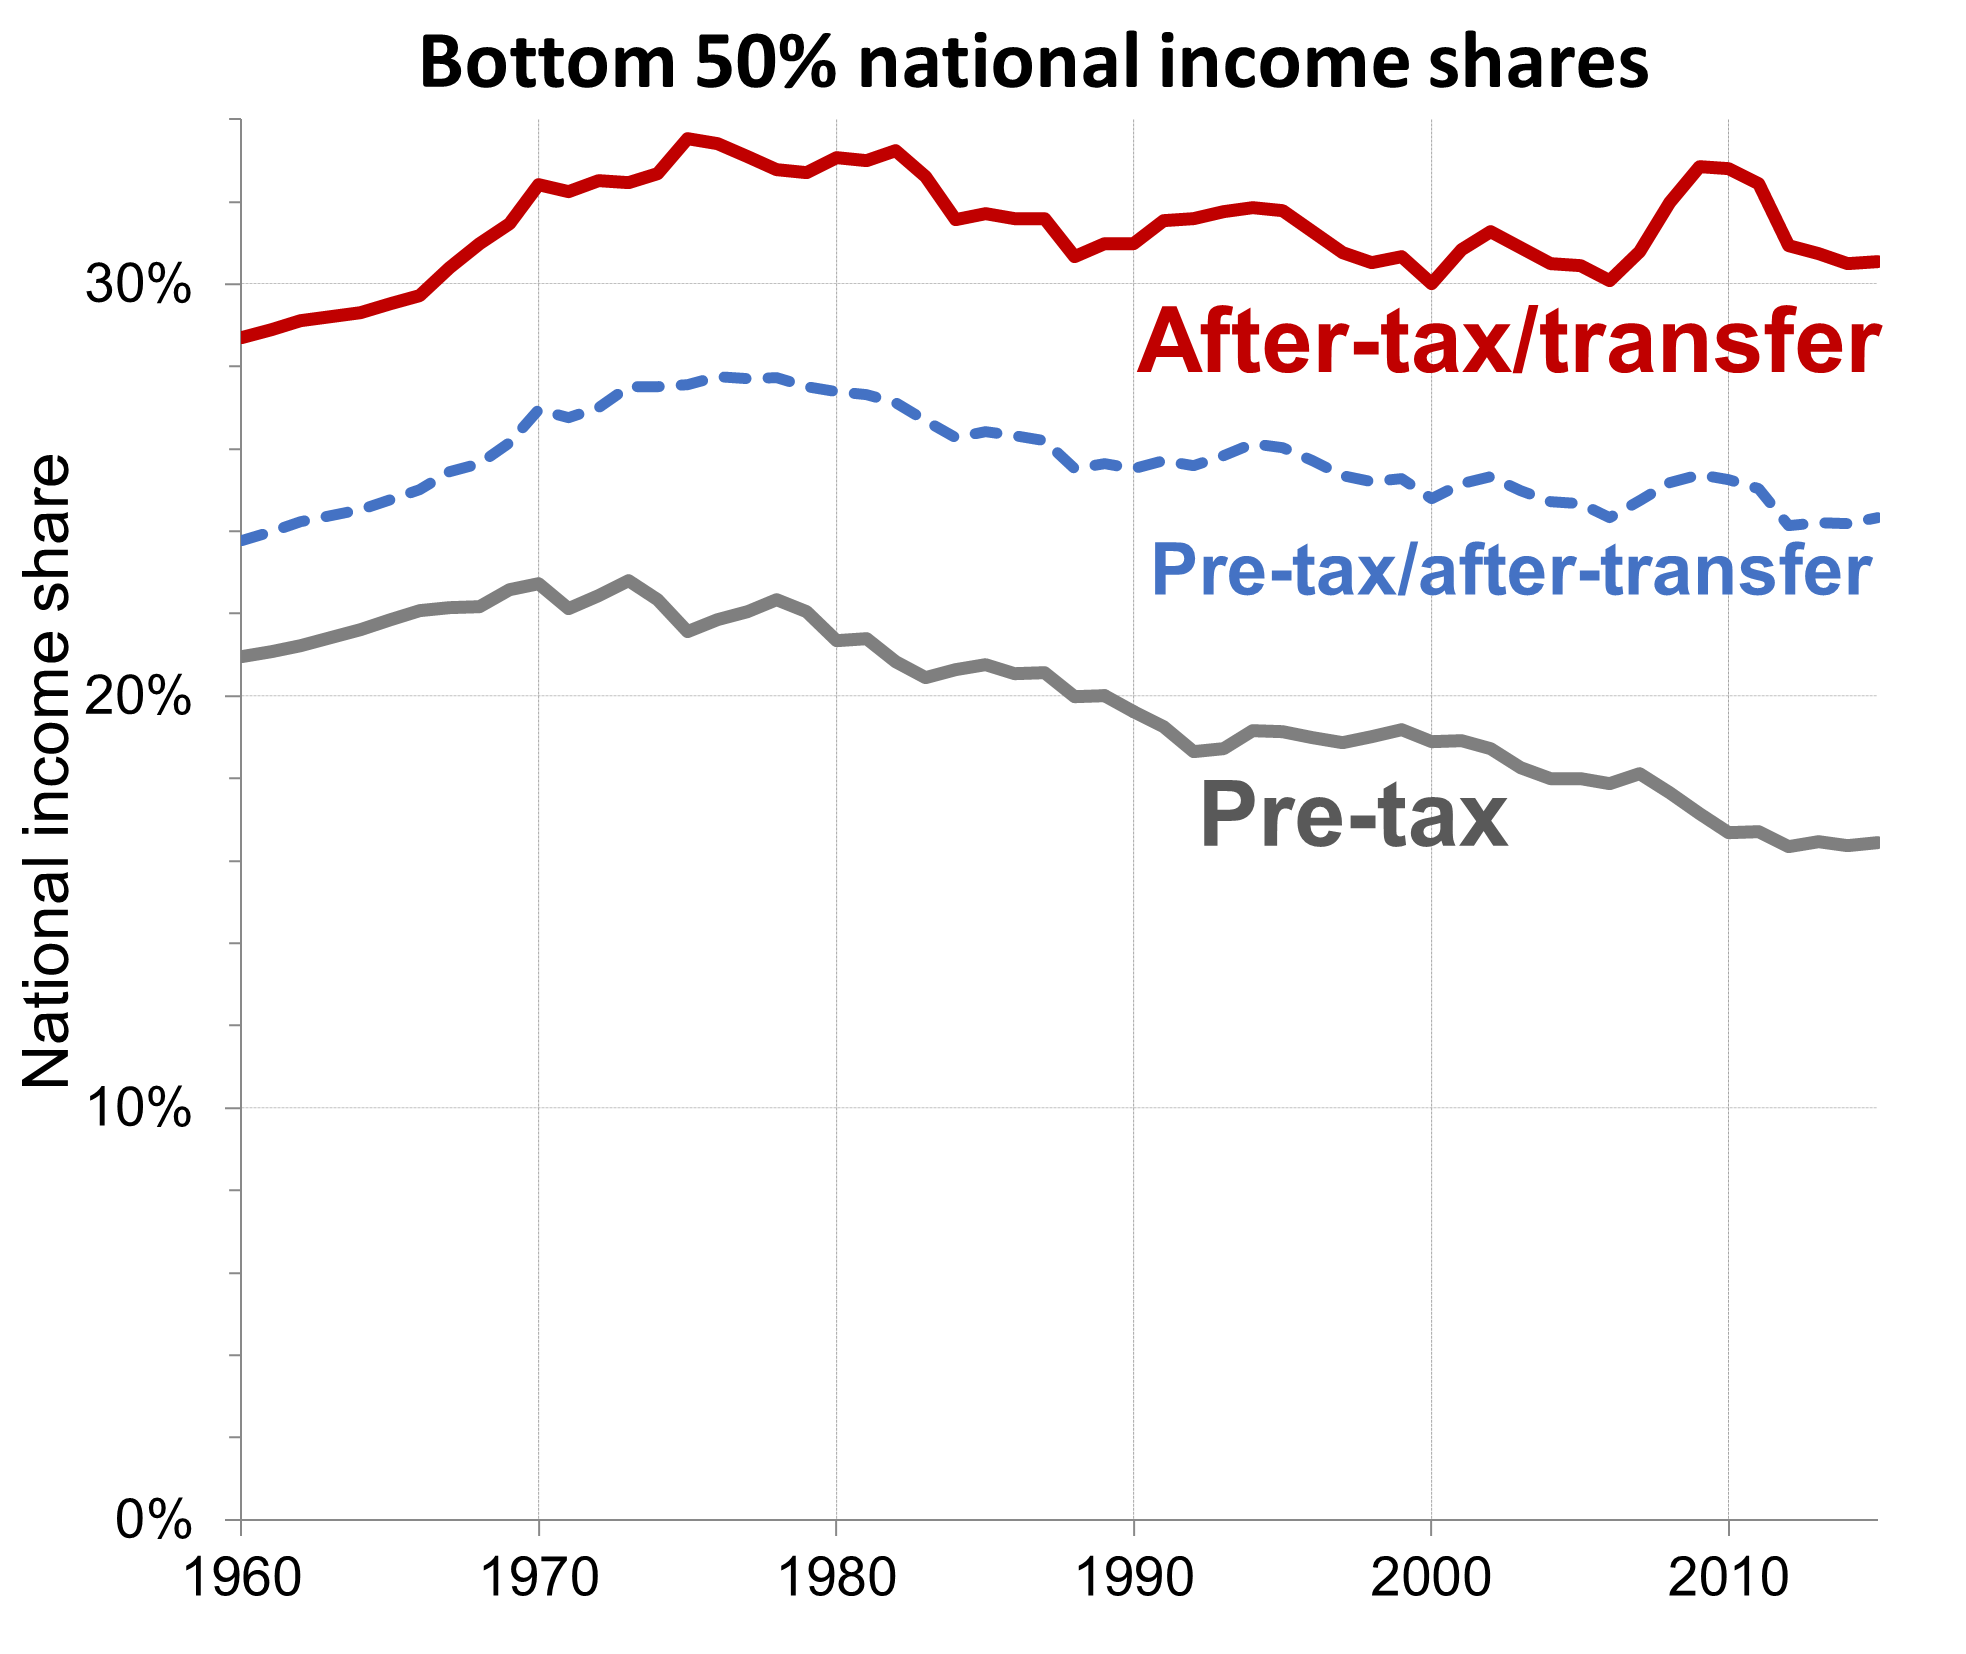
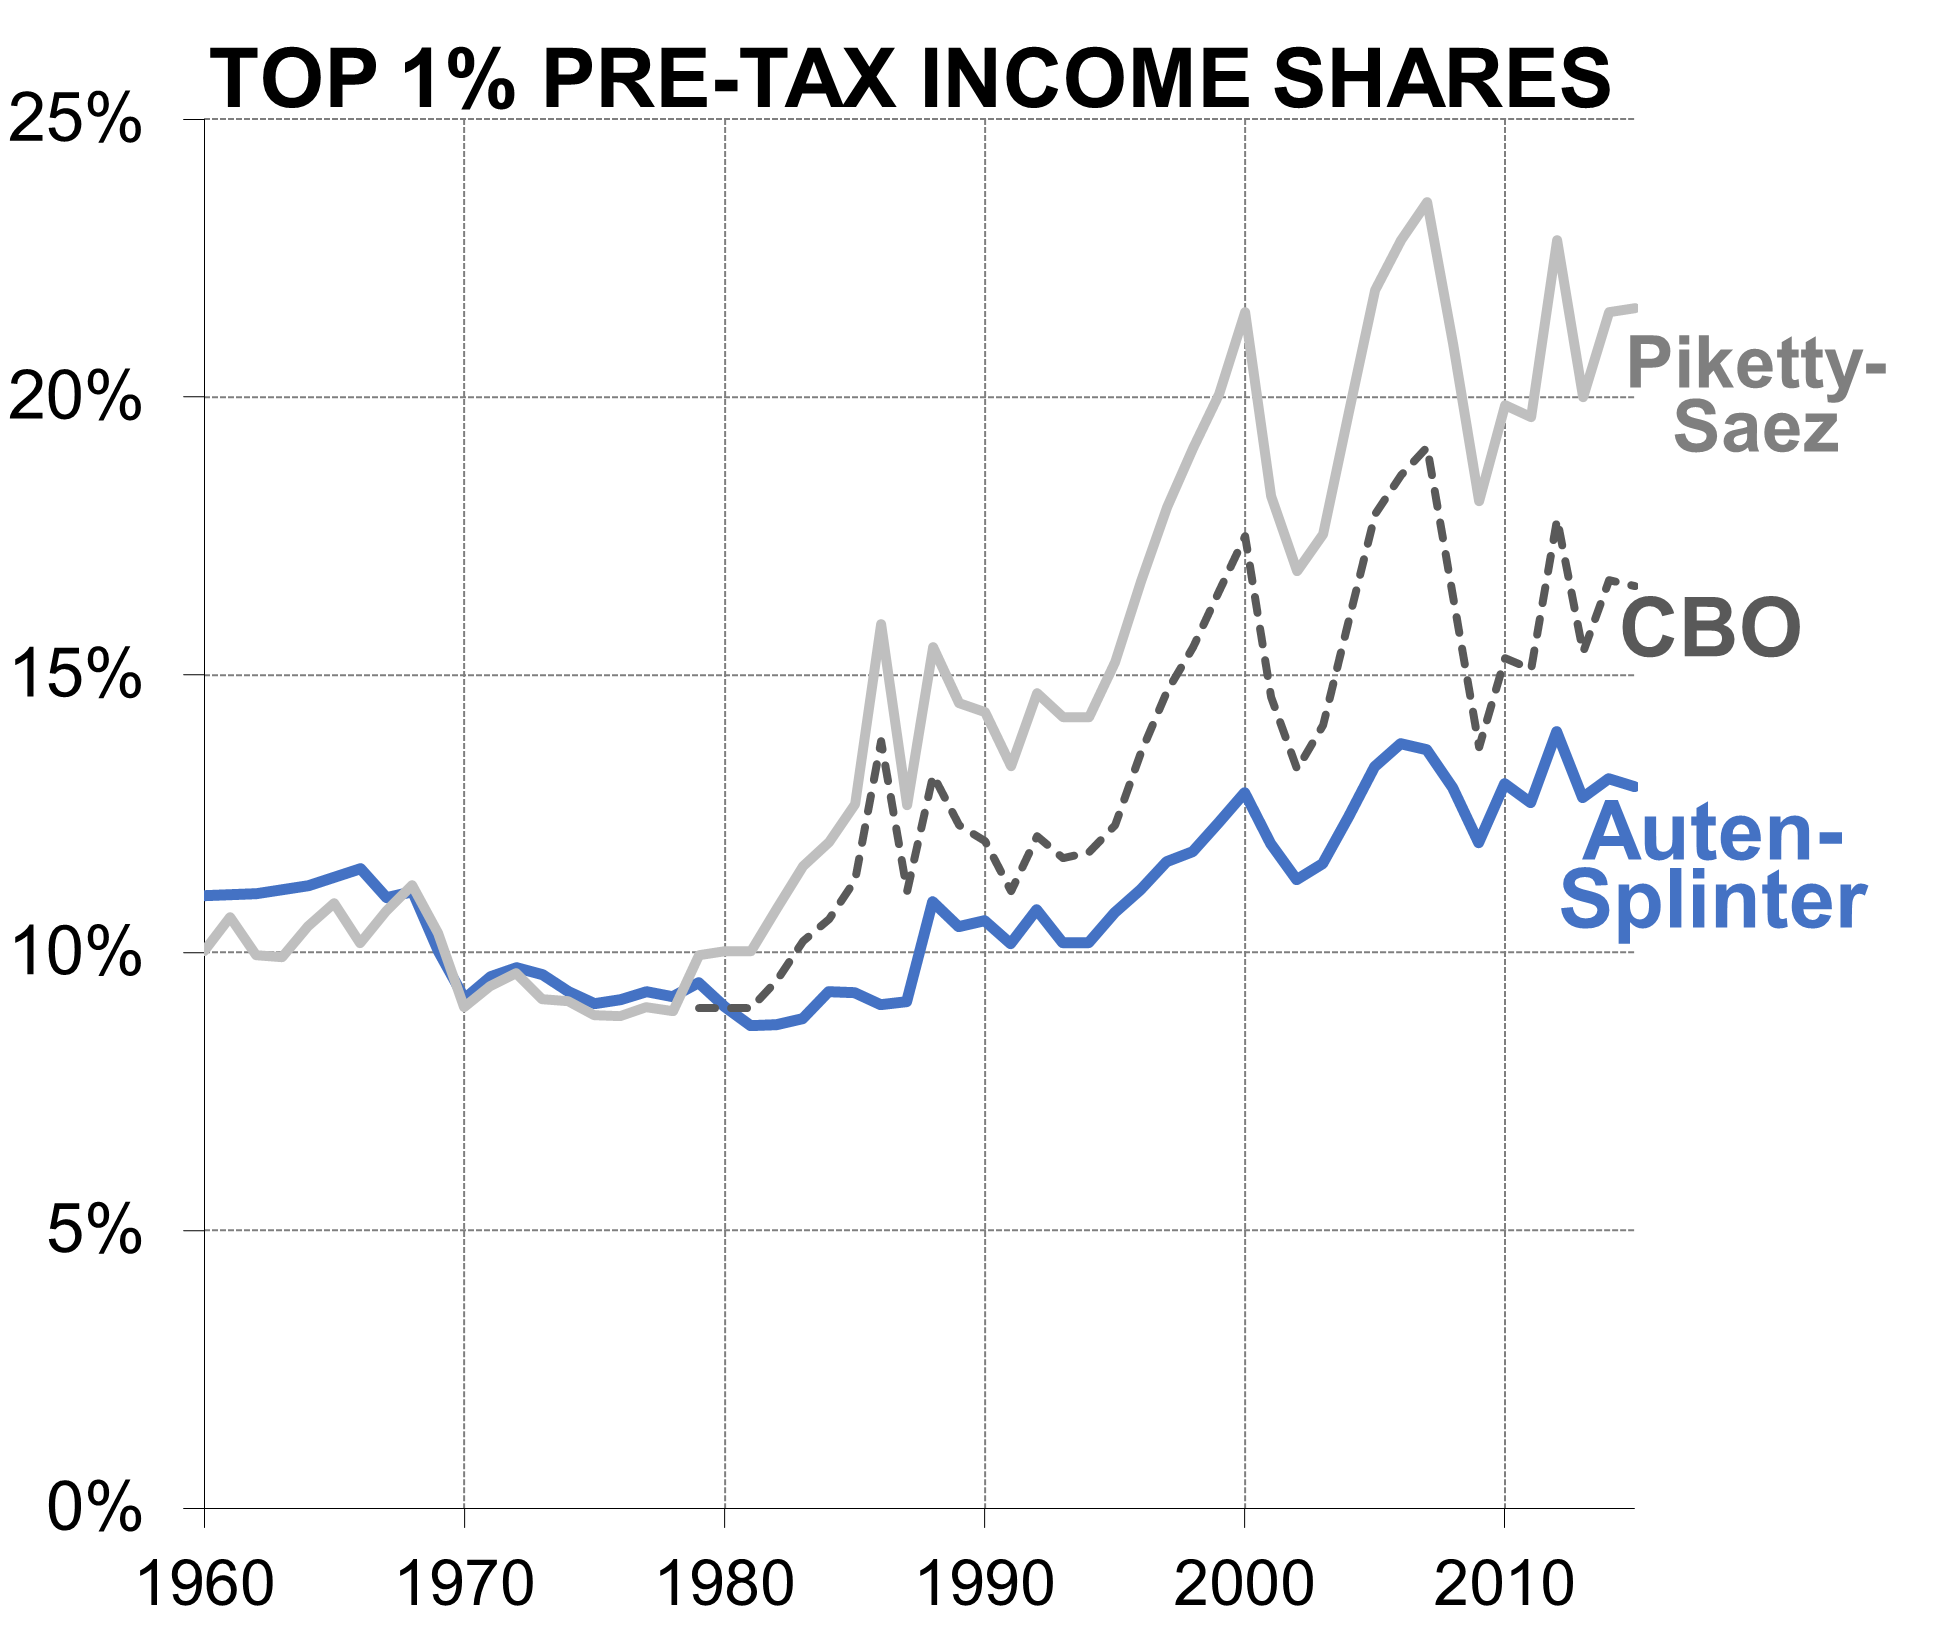
Concerns about income inequality emphasize the importance of accurate income measures. Estimates of top income shares based only on individual tax returns are biased by tax-base changes, social changes, and missing income sources. This paper addresses these shortcomings and presents new estimates of the distribution of national income since 1960. Our analysis of pretax income shows that top income shares are lower and have increased less since 1980 than other studies using tax data. In addition, increasing government transfers and tax progressivity have resulted in rising real incomes for all income groups and little change in aftertax top income shares.
Tax Progressivity and Redistribution
"Is the Laffer Curve Flat?"
with Rachel Moore and Brandon Pecoraro. Working paper, 2026. (Summary, Appendix)
Media: WaPo, BPC, a summary
[Abstract]
The Laffer curve peaks at the revenue-maximizing top tax rate, where revenue losses from behavioral responses offset revenue gains from a higher tax rate. Prior studies, however, largely overlook the Laffer curve's shape, rely on simplified tax functions, and often omit shifting across business types and tax interactions. We show that modeling distinct tax bases more accurately and incorporating these interactions lowers the revenue-maximizing top tax rate and the associated revenue gains, yielding "flat" Laffer curves. Over this flat region, increasing the top tax rate raises relatively little revenue. Instead, raising top rates primarily trades off between progressivity and growth.
"Comment on "How Much Tax Do Billionaires Pay?" Working paper, 2025. (pdf version)
Media: Economist-june, Economist-feb, MR, Barron's, Tax Found., CATO
[Abstract]
The U.S. tax system is highly progressive. Effective tax rates increase from 2% for the bottom quintile of income to 45% for the top hundredth of one percent. But rates may be lower among those with the highest wealth. This comment starts with the "top 400" tax rate estimates by wealth in Balkir, Saez, Yagan, and Zucman (2025 BSYZ), and adjusts these to account for Forbes family wealth being spread across multiple tax returns, to avoid double-counting capital income, to include missing taxes, and to apply standard tax and income definitions. This results in "top 400" effective tax rates exceeding overall tax rates by 13 percentage points. Still, the "top 400" tax rate is lower than for the top hundredth of one percent, suggesting a modest decline in effective tax rates at the very top when ranking by wealth. However, this is an unsurprising deviation from progressive rates because the tax system targets income, not wealth. Compared to the annual estimates in BSYZ, longer-run estimates are more appropriate for top wealth groups, which have volatile wealth and concentrate charitable giving into end-of-life bequests. End-of-life giving suggests long-run top 400 effective tax-and-giving rates could exceed 75%.
"U.S. Tax Progressivity and Redistribution."
National Tax Journal, 2020, 73(4), 1005-1024. (Online Appendix, Excel file, Slides)
[Abstract]
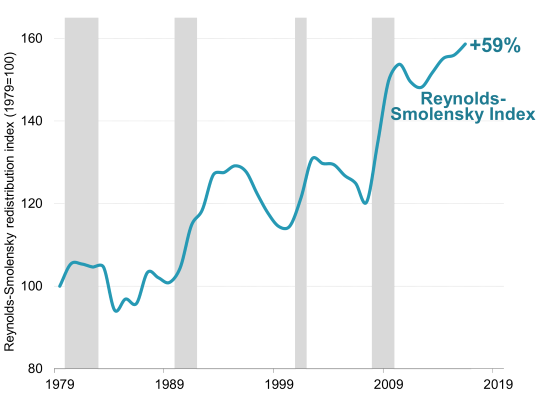
U.S. federal taxes have become more progressive since 1979, largely due to more generous tax credits for lower income individuals. Though top statutory rates fell substantially, this affected few taxpayers and was offset by decreased use of tax shelters, such that high-income average tax rates have been relatively stable. Redistribution, which accounts for both taxes and transfers, has also increased according to Congressional Budget Office data. Measures of progressivity and redistribution, however, capture different aspects of policy. Over the longer run, earlier decreases suggest a U-shaped tax progressivity curve since WWII, with the minimum occurring in 1986.
Increase in Federal Redistribution (estimates from CBO data)
"Middle-Class Redistribution: Tax and Transfer Policy for Most Americans"
with Adam Looney and Jeff Larrimore. In Melissa S. Kearney and Amy Ganz (eds.), Securing Our Economic Future. Washington, DC: Aspen Institute. 2020, 50-81. (Excel file)
Media: WaPo
[Abstract]
The "middle class" has benefitted from government redistribution in recent decades. For individuals in non-elderly households in the middle three income quintiles (the middle class), the share of federal taxes decreased, and the share of transfers increased. Between 1979 and 2016, market income per person increased 39 percent. But when accounting for taxes and transfers income increased 57 percent. Middle-class income support, however, is a recent phenomenon. Before 2000, market income and income after taxes and transfers grew together. Since 2000, middle-class income after taxes and transfers grew three times faster than market income. In a revenue neutral exercise, we explore the limits of further support to the middle class.
"U.S. Taxes are Progressive: Comment on 'Progressive Wealth Taxation'."
Working Paper, 2019. (Online data: Excel)
Media: Economist-2026, Bloomberg, Vox, MRa, MRb, WaPo, Signal, Yahoo, WSJa, WSJb, Quartz
[Abstract]
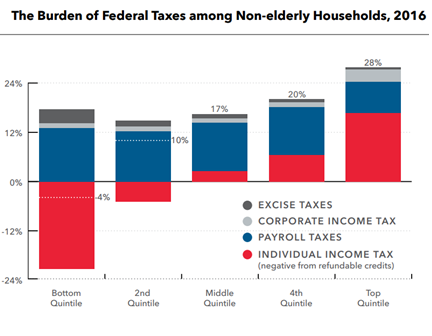
U.S. federal taxes are progressive, as shown by Congressional Budget Office and Tax Policy Center estimates, with average tax rates increasing with income. In fact, the OECD (2011) estimated that the U.S. has the most progressive household taxes among developed countries. Moreover, the 2017 tax reform is expected to have little effect on overall tax progressivity (Tax Policy Center, 2017; Joint Committee on Taxation, 2019). But Saez and Zucman (2019) argue that average tax rates are nearly equal over the income distribution. To examine this claim, this paper compares other estimates of average tax rates by income group, all of which suggest a high degree of progressivity. Three issues are found to bias the average tax rates presented in Saez and Zucman (2019). After correcting for these issues, their estimates align more closely with other estimates that show U.S. taxes are progressive.
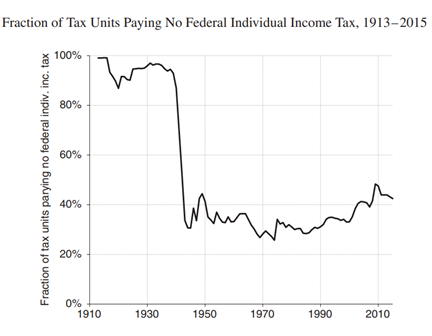
"Who Pays No Tax? The Declining Fraction Paying Income Taxes and Increasing Tax Progressivity." Contemporary Economic Policy, 2019, 37(3), 413-426. (Online data: Excel)
[Abstract]
Using federal individual income tax data, this paper presents the first long-run estimates of the fraction paying no income tax. Between 1985 and 2015, the fraction of working age adults paying no tax increased from 20% to 36%. A decomposition shows that almost all of this increase resulted from changes in tax policy, especially from more generous tax credits. Increasing tax progressivity over the last three decades also resulted from more generous tax credits. The substantial federal tax changes enacted in 2017 are forecasted to temporarily increase both the fraction paying no tax and individual income tax progressivity.
Income Inequality
"Income Inequality in the United States: Using Tax Data to Measure Long-term Trends."
with Gerald Auten. Journal of Political Economy, 2024, 132(7), 2179-2227.
Online appendix
Supplementary appendix
Online data (excel): Extension through 2022, Original through 2019
Slides, Presentation Video, and summary
Computer code (txt)
Updates and Extensions: Extended to 2022
Earlier Versions: 2022, 2019, 2018, 2017, 2016
Replies to Comments: PSZ (2025, 2023, 2020, 2019, supp. app.),
Brookings (2023), Iselin and Reck (2024)
Media: Vox, WaPo2, CNN, WaPo1, MR reply to PSZ, Economist, FT, Bloomberg, Economist (cover 2019), Vox, PBS, Hill, WSJa, WSJb, Politico Tax
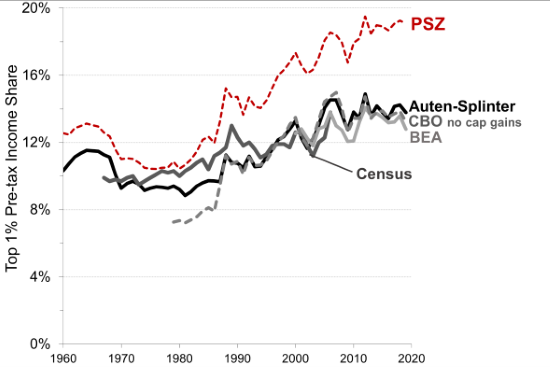
[Abstract]
Concerns about income inequality emphasize the importance of accurate income measures. Estimates of top income shares based only on individual tax returns are biased by tax-base changes, social changes, and missing income sources. This paper addresses these shortcomings and presents new estimates of the distribution of national income since 1960. Our analysis of pretax income shows that top income shares are lower and have increased less since 1980 than other studies using tax data. In addition, increasing government transfers and tax progressivity have resulted in rising real incomes for all income groups and little change in aftertax top income shares.
"Reply to Dube (2026): The Debate on U.S. Income Inequality." Working paper, 2026.
[Abstract]
This paper replies to Dube (2026), who reviews the debate over U.S. income inequality estimates from Piketty-Saez-Zucman and Auten-Splinter. It clarifies the inconsistency of the CBO income series, the allocation of underreported income and excess depreciation, wage inequality trends, and the treatment of deficits, government consumption, and sales taxes. Several claims in Dube's review mischaracterize the Auten-Splinter approach or misdiagnose the sources of disagreement. The review also ignores the main factors lowering inequality relative to tax-reported income: the growth of untaxed employee compensation, transfers, and tax progressivity. The Auten-Splinter findings remain robust: after-tax top income shares show limited long-run growth.
"Income Inequality in the United States: Extensions and Updates"
with Gerald Auten. Working paper, 2025. (Excel file)
[Abstract]
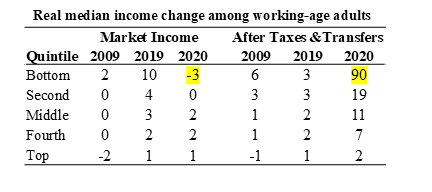
Auten and Splinter (2024) estimated national income inequality using tax data. This paper extends these estimates to cover the years 2020 to 2022. During the pandemic, fiscal relief offset all the increase in distribution-wide inequality and most of the increase in top 1% income shares. Once pandemic-era relief ended in 2022, however, after-tax income inequality increased. In addition, this paper incorporates several improved methods and uses recently revised national accounts data. Collectively, these updates have only modest effects on top income shares. Finally, sensitivity tests show a narrow range around our baseline top income shares (see figure below). Top income shares declined in the late 1960s and increased in the late 1980s and 1990s with little net change. From 1962 to 2019, top 1% after-tax income shares increased only up to one percentage point. Since 2019, both pre-tax and after-tax top 1% shares increased another percentage point.
"Reply to Piketty, Saez, and Zucman (2024): Income Inequality in the United States."
with Gerald Auten. Working paper, 2025. (Excel file)
[Abstract]
National income inequality estimates using tax data must allocate missing income. Starting with estimates from Auten and Splinter (2024, AS), a comment by Piketty, Saez, and Zucman (2024, PSZ) replaces certain AS allocations of missing income with PSZ allocations. This reply shows that these PSZ adjustments fail to address AS arguments, use problematic back-of-the-envelope estimates, and depend on inappropriate distributions of income reported on tax returns. AS allocations use more appropriate data to allocate each missing income source. For example, the AS approach is more consistent with actual partnership depreciation distributions and with underreported income distributions found in special audit studies.
"The Distribution of Capital Gains in the United States: A Comment"
Working paper, 2025.
[Abstract]
National income is estimated based on a consistent treatment of economic income flows. Research on the distribution of income (Piketty, Saez, and Zucman 2018; Auten and Splinter 2024) uses these agreed upon national income concepts. Notably, national income excludes accrued capital gains, as income is only generated by an underlying asset when it contributes to current-year production. Capital gains, in contrast, are based on volatile asset-price changes and are not meaningful measures of economic income. Adding capital gains to national income breaks the consistent approach to income measurement, shifts capital income forward in time, and exaggerates top income shares. This comment reviews the Campbell, Robbins, and Wylde (2024) approach of incorporating capital gains into national income, challenging their analysis, conclusions, and contributions to the literature.
"Tax Data: Possibilities and Limitations for Joint Measures of Household Income, Consumption, and Wealth." with Jacob Mortenson. Slides, 2024.
[Abstract]
Economic prosperity is not well measured when considering only annual income, wealth, or consumption. We discuss the benefits and limitations of using tax data, as compared to survey data, to estimate joint measures of the distribution of income, wealth, and consumption. Tax data can capture nearly the entire U.S. population and include high-income sources missing from survey data. These data show U.S. taxes have become more proggressive and that overall tax-and-transfer redistribution increased, especially for the bottom-half of the distribution. Tax data, however, are less well-suited for estimating wealth and consumption or how outcomes vary by race.
"Strengths and Limitations of Tax Data for Distributional Estimates." with Jeff Larrimore and Jacob Mortenson. National Academy of Sciences Meeting, July 12, 2022.
[Abstract]
Tax data can capture nearly the entire U.S. population. We review the types of tax data (e.g., annual 1040 returns and information returns), who is included or excluded in these data, how to link tax data to form households, and strengths and weaknesses of income reported in tax data as compared to survey data. Comparing tax-data households to Census households shows similar incomes, although tax data capture more income among the top two percent. Finally, we discuss how to use tax data to measure broader economic income, include government transfers, and remove taxes—allowing estimates of the distribution of disposable income.
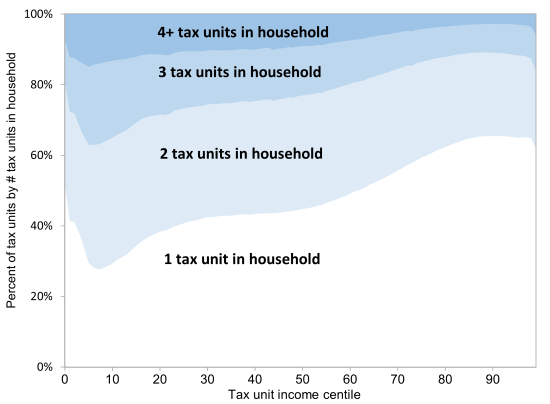
"Household Incomes in Tax Data: Using Addresses to Move from Tax Unit to Household Income Distributions." with Jeff Larrimore and Jacob Mortenson. Journal of Human Resources, 2021, 56(2), 600-631. (online appendix, Excel, working paper, Data files: readme and main)
[Abstract]
A limitation of tax return data is the inability to identify members of separate tax units living in the same household. We overcome this obstacle and present the first set of entirely tax-based household income and inequality measures. We find using tax units as a proxy for households overstates household income inequality, as measured by Gini coefficients, by 13 percent. Consistent with previous findings, we also estimate that the CPS understates household income inequality by 5 percent. Compared to conventional tax-unit measures, the federal income tax code and earned income tax credit are less progressive when measured at the household level.
"Top Income Shares and the Difficulties of Using Tax Data."
with Gerald Auten. In Furchtgott-Roth, Diana (ed.), United States Income, Wealth, Consumption, and Inequality, 125-152. Oxford: Oxford University Press. 2020. (Excel file)
[Abstract]
This chapter reconsiders income methods of estimating of inequality using US tax data. It presents a new approach that accounts for the effects of important social changes, tax reforms, technical tax issues, and the 40 percent of income missing from tax returns. Results suggest much smaller increases in top 1 percent shares of pre-tax income. After accounting for taxes and transfers, top 1 percent shares changed little since 1962. This resulted from substantial increases in transfers and increased overall progressivity of the tax system. While effective tax rates for the top 1 percent show little trend, they declined for the bottom 50 percent. Rather than stagnating, per capita real incomes of the bottom half of the population increased over time. Rather than increasing and capturing most economic growth, incomes of those starting at the top decreased while those starting with low incomes received most of the growth.
"Reply: Trends in US Income and Wealth Inequality: Revising After the Revisionists."
Working paper, 2020. (responds to comments by Saez and Zucman 2020)
[Abstract]
When estimating income inequality with tax data, accounting for missing income presents many challenges. Researchers have adopted different approaches to address these challenges. Saez and Zucman (2020) discuss differences between the national income distributions of Piketty, Saez, and Zucman (PSZ, 2018) and Auten and Splinter (AS, 2019a). Saez and Zucman also make updates to their estimates for retirement income, partially responding to one of the concerns raised in AS. In this reply, I explain that SZ only partly correct this problem and do not address other issues raised by AS. For the allocation of underreported income—the most consequential difference between AS and PSZ—I show that the AS approach conforms with special audit studies in five ways, while the PSZ approach is inconsistent with them. I also provide historical background on the two projects, respond to technical points raised, and discuss estimates of tax progressivity.
"Measuring Income Inequality: Survey vs. Tax Data & Fiscal vs. National Income." Brookings Institution Workshop on Income Inequality, February 19, 2020.
[Abstract]
Survey data suffer from income underreporting, especially in the tails of the distribution (Bollinger et al. 2019). Tax data include more capital income than survey data, resulting in higher estimates of annual income inequality. But tax data also include more middle-class pension income and low-income earnings, resulting in lower estimates of poverty than official measures. Even though more comprehensive than survey data, tax data miss over one-third of national income. This missing income includes middle-class employer-paid benefits (which decrease top income shares) and underreported business income (which audit studies show has little effect on income inequality). Gini coefficients of inequality estimated by CBO and Auten and Splinter (2024) are similar. Inequality of income after taxes and transfers has been about flat since the mid-1980s, as increasing redistribtion offset increasing market inequality. Bottom-half real incomes, after taxes and transfers, increased by over 70 percent between 1979 and 2015. While some have economic instability or persistent poverty, following the same indivdiuals over time with panel data shows economic growth has overall been progressive.
"Top 1% Income Shares: Comparing Estimates Using Tax Data."
with Gerald Auten. AEA Papers & Proceedings, 2019, 109, 307-311. (online appendix responding to Piketty, Saez, & Zucman, Excel file, SAS code, Slides, AEA page)
[Abstract]
Many studies have used tax data to measure the U.S. income distribution, but their results vary widely. For example, in 2014 the top 1 percent share of income is 21.5 percent in Piketty and Saez (2003 and updates), 16.7 percent in the Congressional Budget Office (2018), and 13.1 percent in our analysis. What accounts for such large differences? We provide a step-by-step analysis of how methodological differences affect the results and address issues raised in Piketty, Saez, and Zucman (2018, 2019). Important differences include accounting for declining marriage rates, including social insurance and employer benefits, accounting for tax reforms, and including income missing from tax returns.
"Comment: Inequality and Philanthropy: High-Income Giving in the United States 1917-2012." working paper, 2018. (online data: Excel, STATA based on Duquette 2018: zip file)
[Abstract]
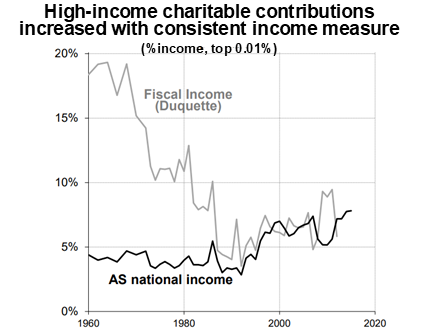
Using tax data over nearly a century, Duquette (2018) estimated that high-income charitable contributions as a share of income moved inversely with income inequality. These estimates relied on fiscal income, an inconsistent measure of income, and public use tax data, which is non-representative of high-income charitable contributions in recent decades. Using measures of national income, a more consistent and comprehensive measure of income, and representative confidential data, I estimate that since 1960, high-income contribution rates moved positively with income inequality. Rather than implying that high-income contributions respond to inequality, this correlation appears related to contemporaneous fluctuations in stock market values and top income shares. These estimates suggest researchers should be cautious when using tax data—especially public use tax data—to study high-income contribution
behavior.
Tax Compliance
"Do Marriage Penalties Cause Delayed Marriage Reporting?"
with William Gorman. Working paper, 2025. (summary, appendix)
[Abstract]
Couples can face higher taxes when filing as married rather than unmarried. These marriage penalties may motivate newlyweds to delay reporting their marriage on U.S. tax returns. Linking marriage records to federal tax returns, we show marriage penalties are correlated with delayed marriage reporting. Over 2% of newlyweds misreport their marital status. Misreporting rates increase to 14% when marriage penalties reach $8,000. Misreporting and large marriage penalties are more prevalent among couples with similar earnings and claiming Earned Income Tax Credits. Misreporting couples respond to incentive changes, often correcting their filing status when marriage penalties become bonuses.
"Who Evades Taxes? The Distribution of the U.S. Tax Gap."
with William Gorman and Jamie McGuire. 2025. For Proceedings of the 15th Annual IRS-TPC Research Conference on Tax Administration. (Slides, presentation at 5:28)
[Abstract]
Tax gaps measure underpaid taxes. This study provides a comprehensive analysis of the tax gap over the income distribution, accounting for the full tax gap and various years. Using random audit studies and certain IRS assumptions, we show that tax noncompliance rates are highest among those with the lowest incomes. This result is robust to different assumptions. Tax noncompliance rates are four times higher for the bottom quintile than for the top 1% of the income distribution. This divergence increased over time—the bottom-quintile has become less compliant and the top 1% more compliant.
"Double-Claimed Dependents: Did E-Filing Lower U.S. Tax Noncompliance?"
with William Gorman and Jamie McGuire. International Tax and Public Finance, 2025, https://doi.org/10.1007/s10797-025-09926-4. (Excel file)
[Abstract]
Children should only be claimed on a single tax return, but some are claimed on two returns, or double-claimed. While many countries use child registries to prevent double-claiming, the United States tax authority does not. As a result, in 2001 the U.S. had over one million double-claimed dependents. Despite increasing child tax benefit values, the number of double-claimed dependents in the U.S. decreased by 80 percent over the last two decades.
This paper documents this decrease and suggests it partly resulted from an increase in electronically filed returns, as double-claiming causes automatic e-file rejections. The decrease in double-claimed dependents avoids over 50,000 annual audits and reduces annual tax credit payments by about $3 billion. Our findings suggest e-filing may have helped lower tax noncompliance more broadly over this period, as the IRS also rejects e-filed returns for many other reasons. Additionally, double-claiming illustrates a consequence of tax complexity, as dependent-claiming rules are often not straightforward. This analysis is also timely. There have been two recent proposals for U.S. child registries, and the IRS just reversed its longstanding policy to now allow e-filed double-claiming.
"Reply to Iselin and Reck (2024): Income Inequality in the United States."
with Gerald Auten. Working paper, 2024. (Excel file)
[Abstract]
Auten and Splinter (2024, AS) used tax data to estimate national income distributions. Underreported income amounts in national income are based on IRS random audit studies. AS therefore used detailed distributions from these audit studies to allocate underreported income. Iselin and Reck (2024) commented on AS. But that comment misrepresents the AS audit-study-based underreporting allocation, criticizes an old allocation method that has been replaced, relies on estimates that ignore the audit study findings and how underreporting interacts with reported losses, suggeststhat national income distributions should deviate from national income, and ignores growing middle-class tax exemptions that explain why national income inequality increased more slowly than tax-reported income inequality.
"Comment: Tax Evasion at the Top of the Income Distribution: Theory and Evidence."
with Gerald Auten, Working paper, 2021. (Slides, comment on Guyton et al. 2021)
[Abstract]
Income underreporting is difficult to account for when measuring the distribution of income. Prior research has relied on special comprehensive IRS National Reporting Program (NRP) audit studies. Guyton, Langetieg, Reck, Risch, and Zucman (2021) bring attention to limitations of the NRP audits for detecting income from offshore assets and passthrough businesses. While underreporting is a serious issue, there are problems with the specific assumptions for allocating this income, such as inappropriate use of simple multipliers to account for undetected amounts and allocating misreported business income in proportion to reported business income. This comment examines methodological issuesthat potentially biasthe results and suggestsimprovementsthat would be distributionally consistent. While uncertainty necessarily remains, there may be less additional underreporting and improved approaches suggest that underreported income may be less concentrated at the top.
COVID-19: Income Shocks and Policy Responses
"The Paycheck Protection Program: Progressivity and Tax Effects."
with Eric Heiser, Michael Love, and Jacob Mortenson.
National Tax Journal, 2026, 79(2), 409-429. Excel file, Appendix)
[Abstract]
The $800 billion Paycheck Protection Program (PPP) provided pandemic relief to businesses retaining employees. Prior research has not directly estimated the PPP's distributional or tax effects. Linking PPP loans to tax records, we estimate progressive effects with respect to income for both workers and business owners. Bottom-quintile incomes increased 18 percent and top-quintile incomes increased 2 percent. About half of PPP relief benefitted workers. The PPP also increased taxes and decreased unemployment compensation, reducing net program costs by one-quarter. Net costs could have been even lower (and progressivity higher) without the tax exclusion of PPP forgiveness.
"Earnings Business Cycles: The Covid Recession, Recovery, and Policy Response."
with Jeff Larrimore and Jacob Mortenson. Journal of Public Economics, 2023, 225, 104983.
(online appendix, Slides, Excel file, Dec. 2022 version, Oct. 2022 version)
Media: Atlantic, Yglesias, Noah Smith
[Abstract]
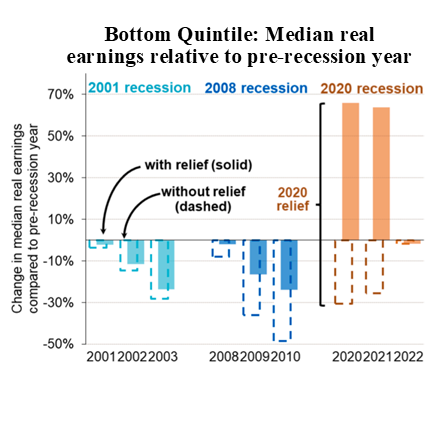
Using a panel of tax data, we follow individuals' earnings over business cycles. Compared to prior recessions, the Covid policy response and recovery were more progressive. Among workers starting in the bottom quintile, median real earnings including fiscal relief increased 66 percent in 2020—after the prior two recessions this measure decreased. This resulted from substantial Covid-era stimulus payments and unemployment insurance. With fiscal relief ending, bottom-quintile earnings in 2022 returned near pre-Covid levels. Among those starting in the top quintile, median real market earnings rose in 2020. Top-quintile earnings subsequently fell, although by less than around previous recessions.
"Stimulus Checks: True-Up and Safe-Harbor Costs."
National Tax Journal, 2023, 76(2), 349-366. (Slides)
[Abstract]
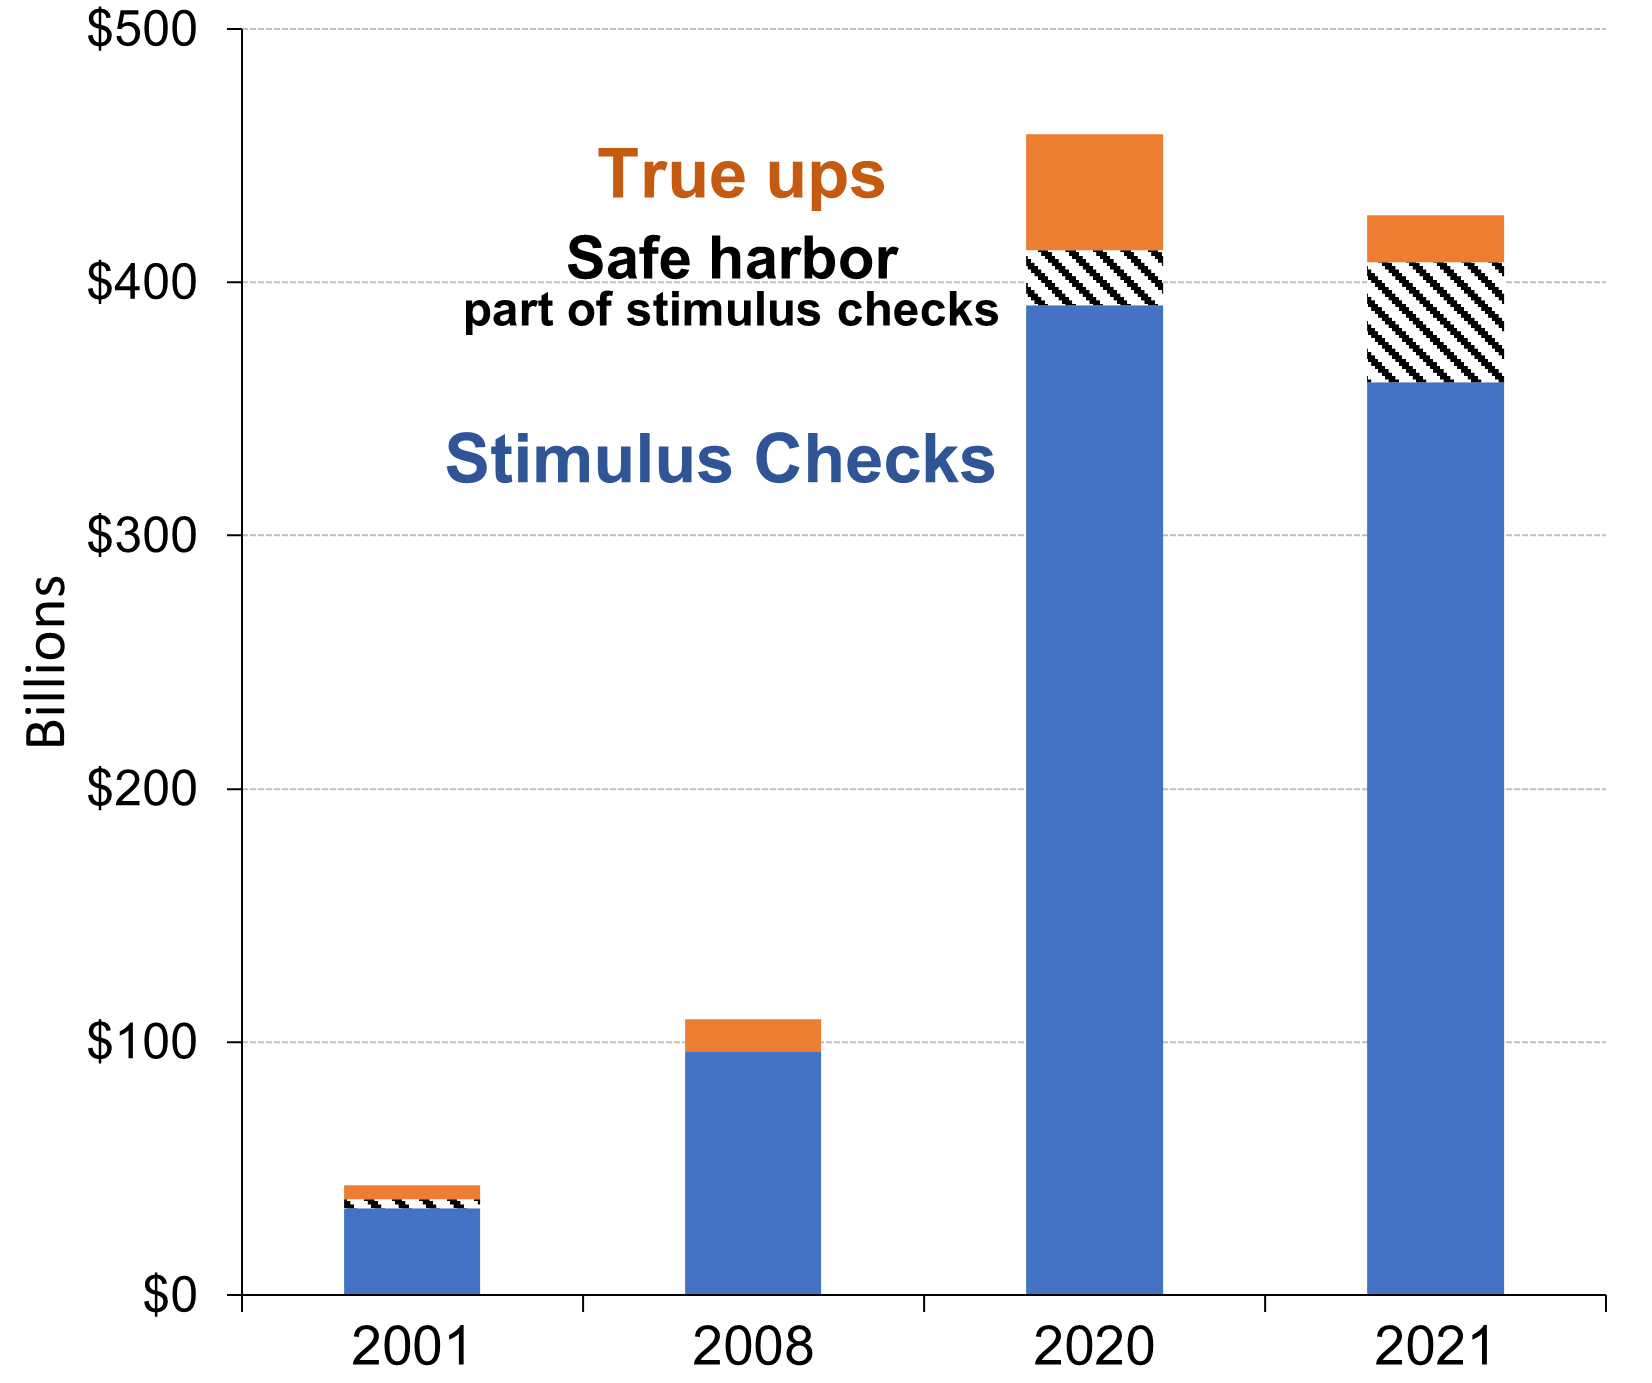
Stimulus checks were sent in response to recent US recessions. These checks grew from about $40 billion in the 2001 recession to $800 billion in the COVID era. Prior studies, however, ignored additional stimulus received upon filing tax returns (true-ups) and safe harbors that prevent possible stimulus repayment. Using population-level tax data, I estimate true-up and safe-harbor costs and decompose them by reasons, such as changes in income or the number of children. True-ups and safe harbors are costly. For the three rounds of COVID-era stimulus, true-ups and safe harbors cost more than $130 billion.
"Unemployment Insurance in Survey and Administrative Data."
with Jeff Larrimore and Jacob Mortenson. Journal of Policy Analysis and Management, 2023, 42(2), 571-579. https://doi.org/10.1002/pam.22463 (Excel file, imputation: readme, dta file, merge do file, merge dta creation, original do file)
[Abstract]
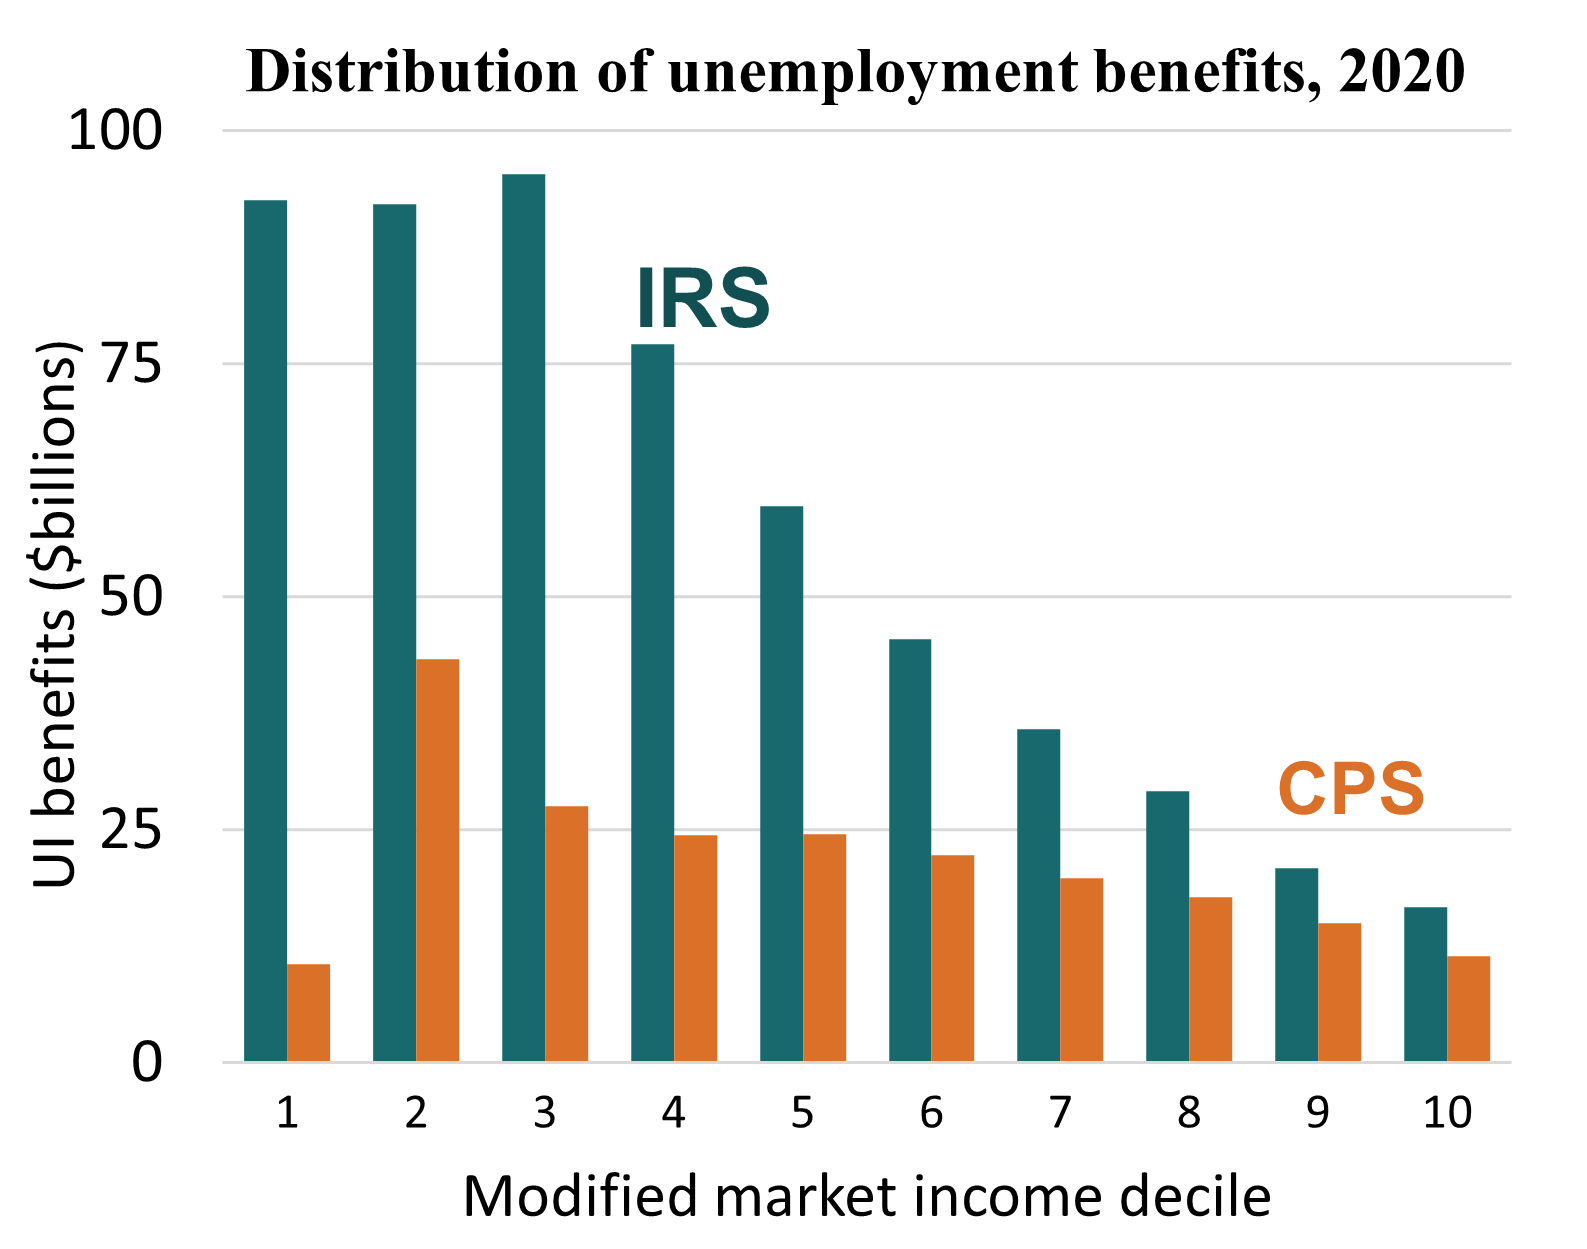
Unemployment Insurance (UI) benefits were a central part of the social safety net during the Covid-19 recession. UI benefits, however, are severely understated in surveys. Using administrative tax data, we find that over half of UI benefits were missed in major survey data, with a greater understatement among low-income workers. As a result, 2020 official poverty rates were overstated by about 2 percentage points, and corrected poverty reached a six-decade low. We provide data to correct underreporting in surveys and show that, compared to UI benefits, the UI exclusion tax expenditure was less targeted at low incomes.
"Income Declines During Covid-19." with Jeff Larrimore and Jacob Mortenson.
AEA Papers and Proceedings, 2022, 112, 340-344. (Excel file)
[Abstract]
The COVID-19 recession caused regressive market income changes in the United States, with large losses more frequent than during the Great Recession and more concentrated at the bottom of the distribution. Progressive taxes and transfers, especially from expanded unemployment insurance benefits and stimulus checks, dramatically offset these declines. We use administrative tax data to show that public policies made large annual tax-unit level income declines in 2020 less common than during the Great Recession, as well as 2019, an expansionary year. These policies stabilized incomes over the entire distribution, but this effect was strongest among those starting with low incomes.
"Earnings Shocks and Stabilization During Covid-19."
with Jeff Larrimore and Jacob Mortenson. Journal of Public Economics, 2022, 206, 104597.
(twitter summary, PrePrint, and Federal Reserve versions) Media: Yahoo
[Abstract]
This paper documents the magnitude and distribution of U.S. earnings changes during the COVID-19 pandemic and how fiscal relief offset lost earnings. We build panels from administrative tax data to measure annual earnings changes. The frequency of earnings declines during the pandemic were similar to the Great Recession, but the distribution was different. In 2020, workers starting in the bottom half of the distribution were more likely to experience an earnings decline of at least 10 percent. While most workers experiencing large annual earnings declines do not receive unemployment insurance, over half of beneficiaries were made whole in 2020, as unemployment insurance replaced a median of 105 percent of their annual earnings declines. After incorporating unemployment insurance, the likelihood of large earnings declines among low-earning workers was not only smaller than during the Great Recession, but also smaller than in 2019.
Income Mobility
"Income Mobility of the Top One Percent."
with Jeff Larrimore. Working paper, 2026. (Summary, Appendix, FedRes wp, Excel file)
[Abstract]
Circulation into and out of the top one percent is pronounced in the U.S. One third exit after a year and two-thirds exit after a decade. This mobility lowers top income shares when shifting from annual to multi-year income measures. Intragenerational mobility over two decades lowers recent top one percent fiscal income shares by over 10 percent. Two-decade mobility reduces top 0.1% shares by over 20 percent, top 0.01% shares by 30 percent, and top 0.001% shares by 40 percent. Effects of variability on wealth inequality are similar in magnitude, although more modest as a share of top wealth inequality.
"Income Mobility and Inequality: Adult-Level Measures from the U.S. Tax Data since 1979." Review of Income and Wealth, 2022, 68(4), 906-921. https://doi.org/10.1111/roiw.12501. (online appendix and Excel file, earlier title: Income Mobility and Inequality in the United States: Evidence from Tax Data since 1979.)
[Abstract]
A panel of tax returns shows that income mobility can explain between none and three-quarters of the increase in annual inequality since the 1980s. These estimates are sensitive to different measures of inequality, income definitions, and sample restrictions—mostly due to different treatments of meanreverting income changes among those with temporarily low incomes. This range of results suggests that sensitivity analyses are crucial to understand the robustness of income inequality and mobility measures.
"Presence and Persistence of Poverty in U.S. Tax Data."
with Jeff Larrimore and Jacob Mortenson. In Raj Chetty, John N. Friedman, Janet C. Gornick, Barry Johnson, and Arthur Kennickell (eds.), Measuring Distribution and Mobility of Income and Wealth. Cambridge, MA: NBER. 2022, 383-410. (Excel data, Slides, NBER version)
[Abstract]
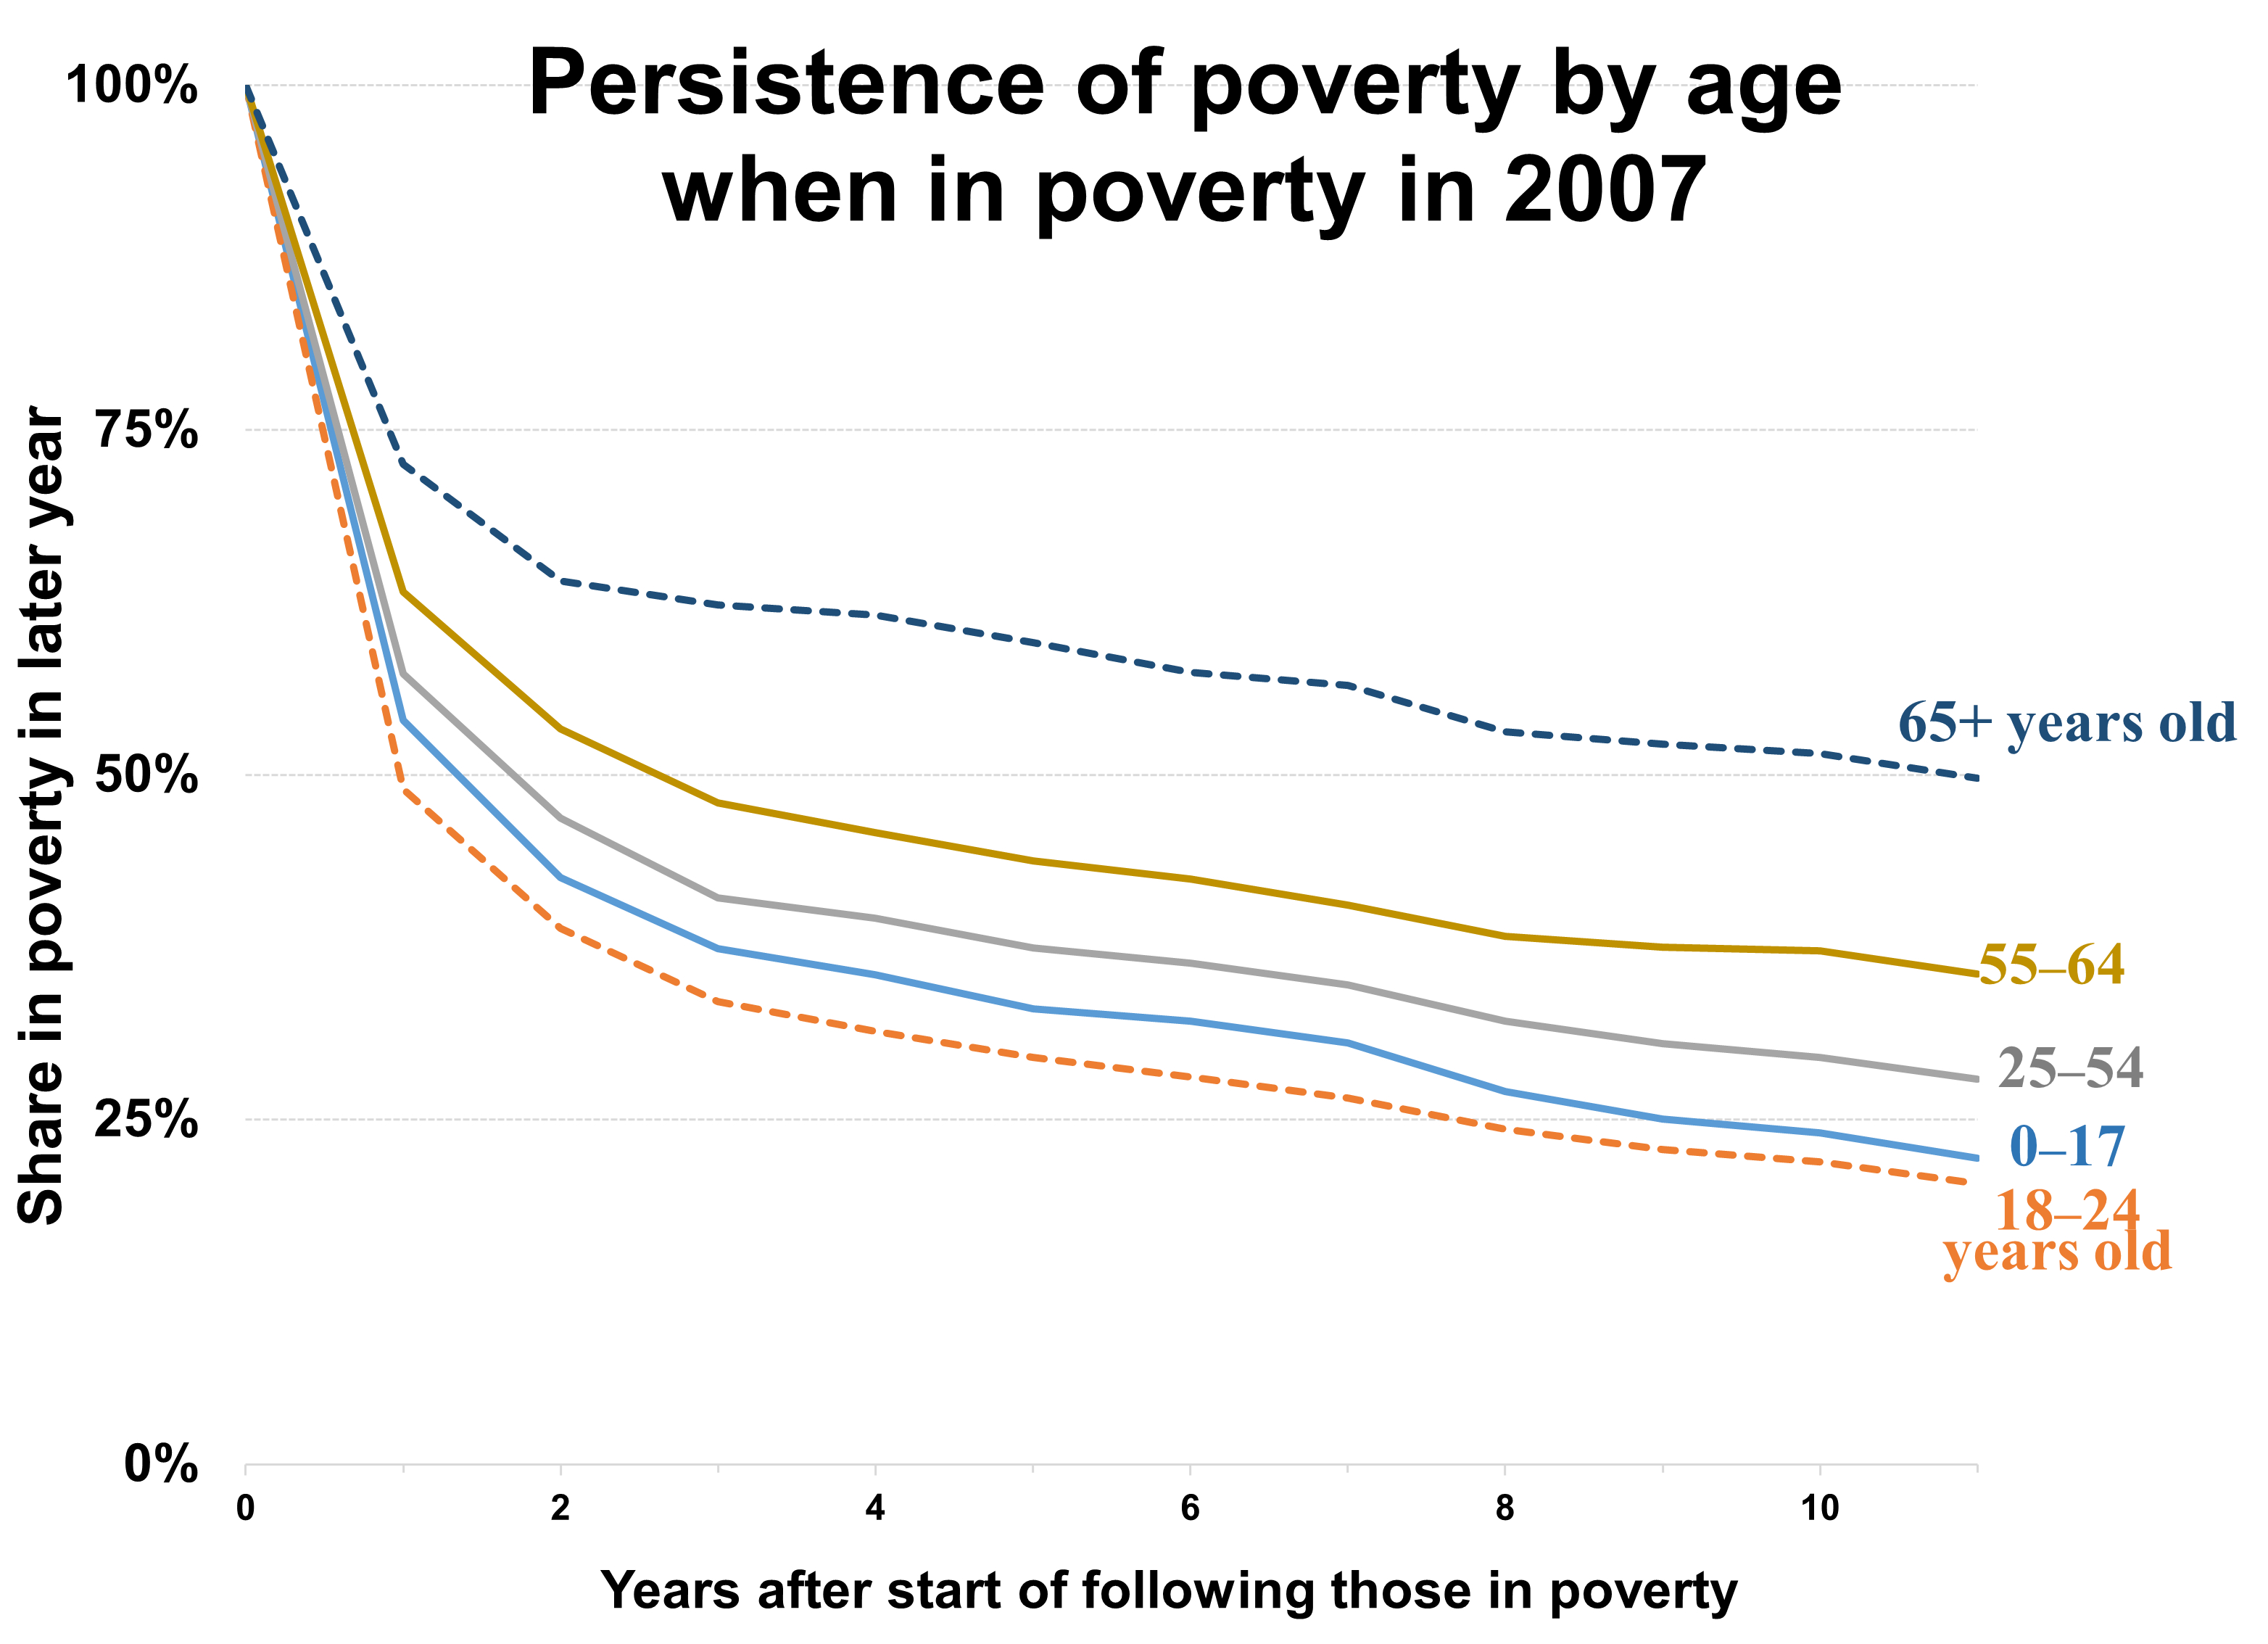
This paper presents new estimates of the level and persistence of poverty among U.S. households since the Great Recession. We build annual household data files using U.S. income tax filings between 2007 and 2018. These data allow us to track individuals over time and measure how tax policies affect poverty trends. Using an after-tax household income measure, we estimate that while roughly 1 in 10 people are in poverty in any given year, over 4 in 10 people spent at least one year in poverty between 2007 and 2018. This implies substantial mobility in and out of poverty—for example, 41 percent of those in poverty in 2007 were out of poverty in the following year. Others spend multiple years in poverty or escape poverty only to fall back into it. Of those in poverty in 2007, one-third were in poverty for at least half of the years through 2018.
"Progressive Growth: Comparing Cross-Sectional and Panel Approaches."
working paper, 2019. (Online data: Excel)
[Abstract]
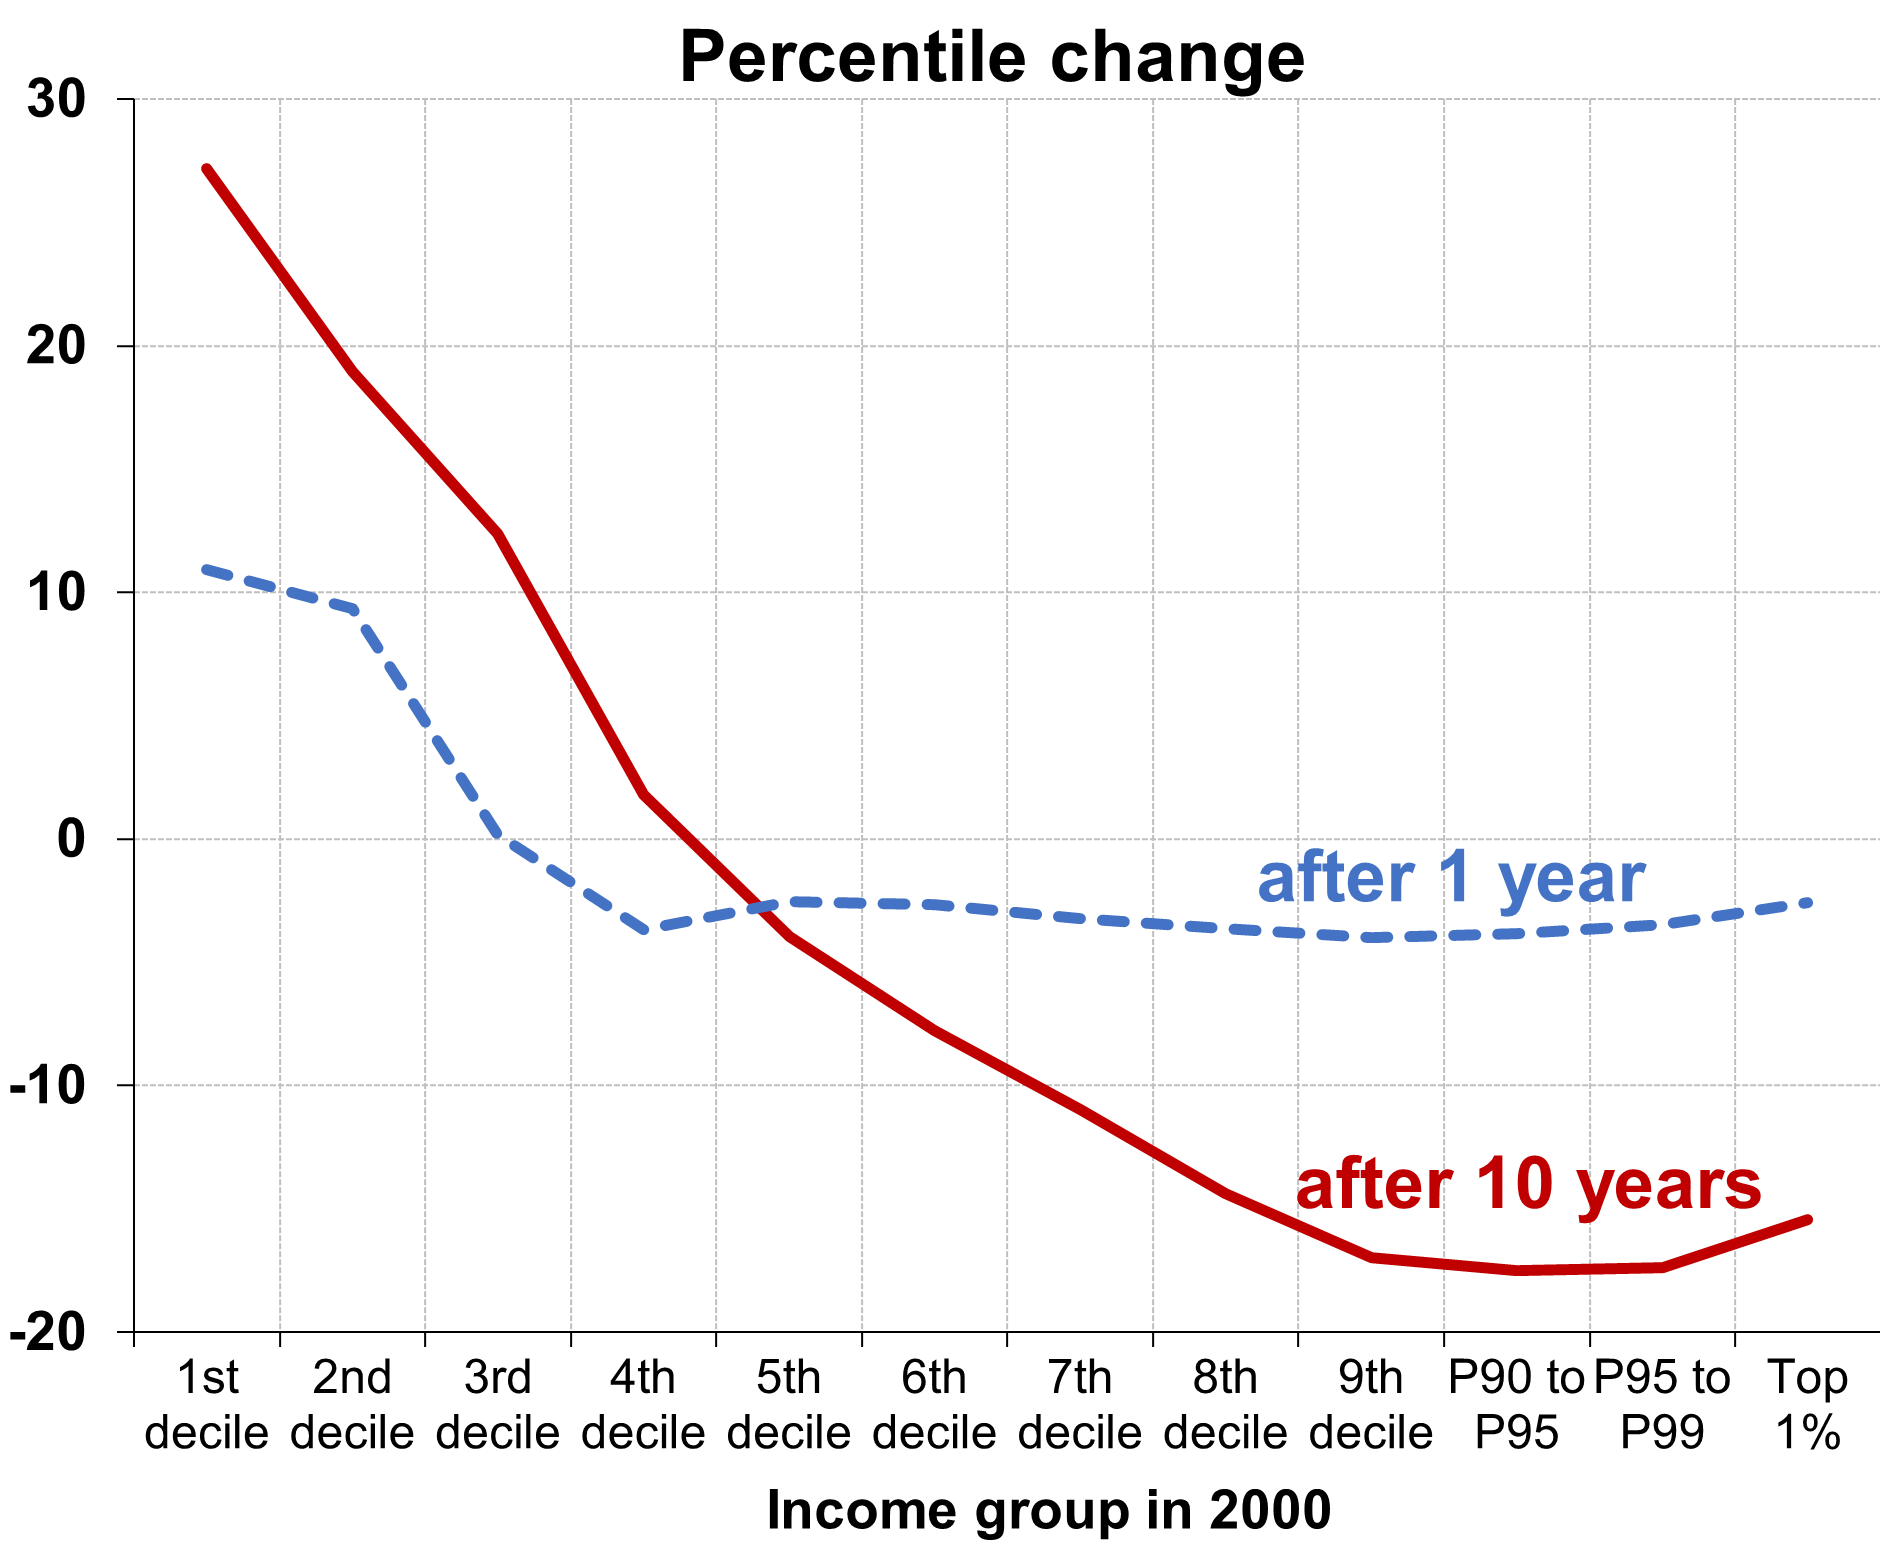
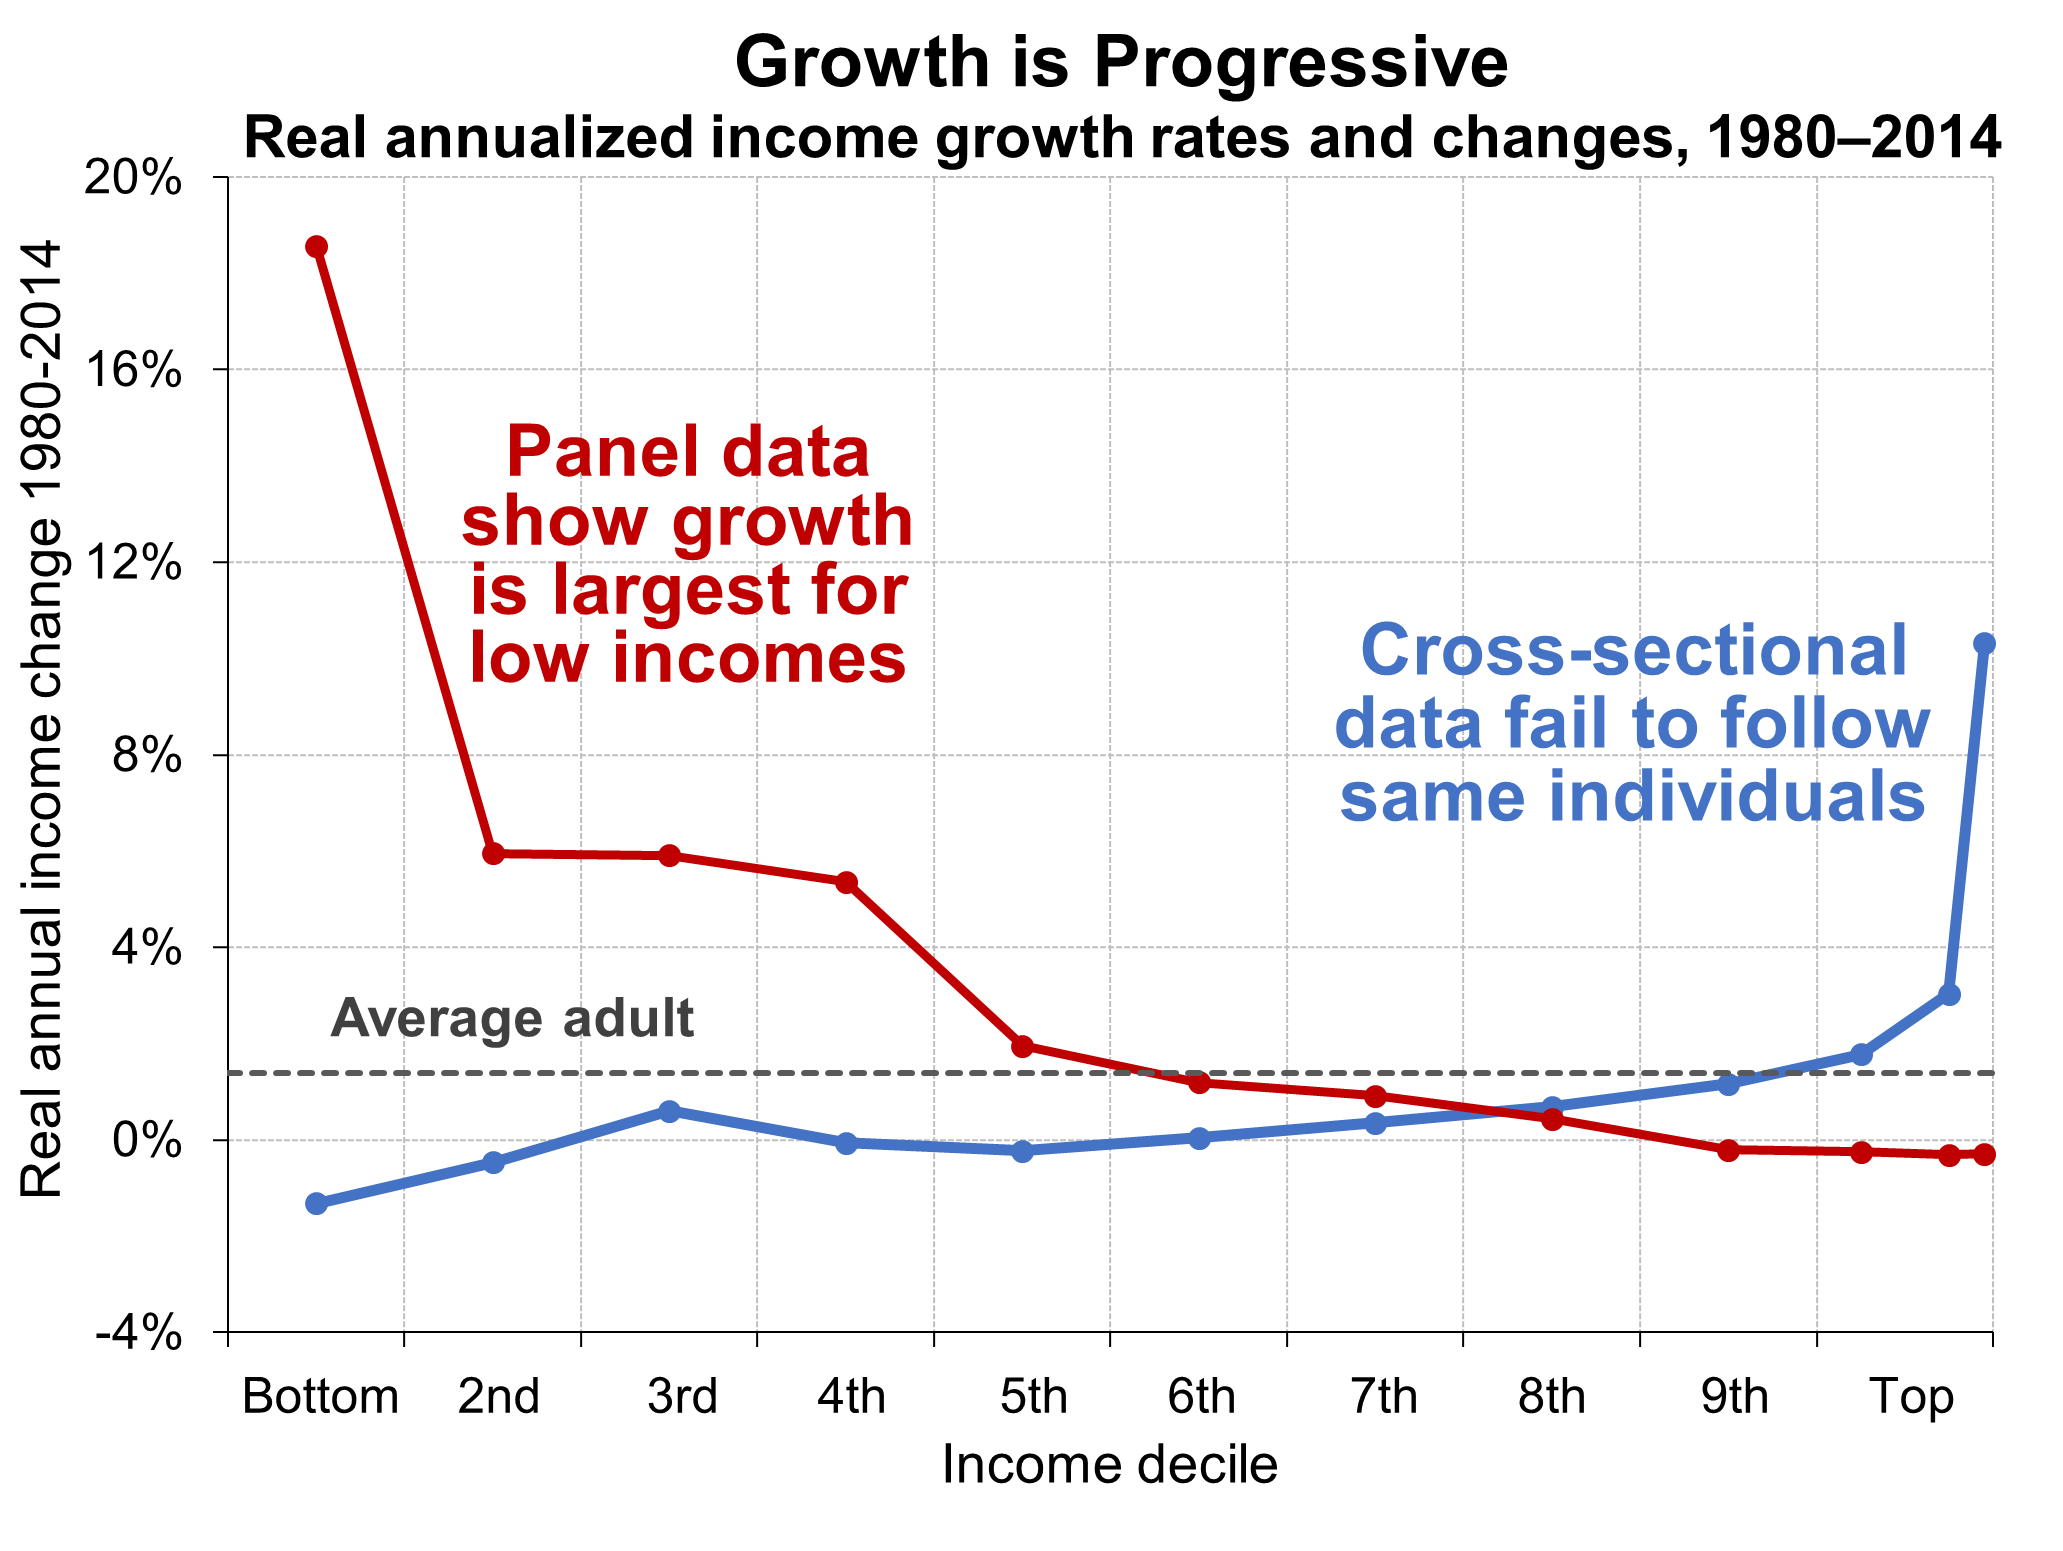
How has U.S. economic growth been distributed since 1980? A number of studies take increases in annual income inequality as evidence of regressive growth. These cross-sectional comparisons, however, provide an incorrect measure of which individuals benefit from growth because of a failure to account for income mobility. A panel approach, in comparison, controls for mobility. A tax return panel shows that those starting at the bottom of the income distribution earned the largest percentage gains, while those starting at the top had the largest losses—implying progressive growth.
"Income and Earnings Mobility in U.S. Tax Data."
with Jeff Larrimore and Jacob Mortenson, in Federal Reserve Bank of St. Louis and the Board of Governors of the Federal Reserve System (Eds.) Economic Mobility: Research & Ideas on Strengthening Families, Communities & the Economy, 2016, 481-516. (working paper)
[Abstract]
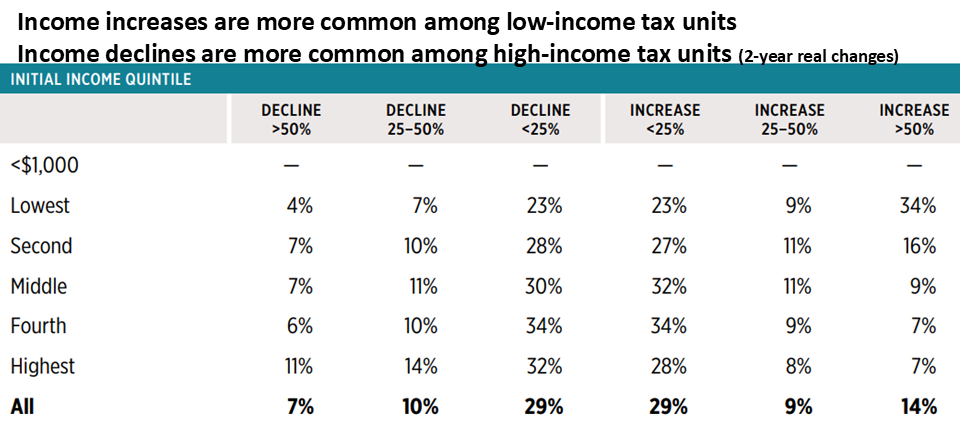
We use a large panel of federal income tax data to investigate intragenerational income mobility in the United States. We have two primary objectives. First, we explore the determinants of twoyear changes in individual labor earnings and family incomes, such as job or industry changes, marriage, divorce, and geographic mobility. Second, we evaluate how federal income taxes stabilize or destabilize post-tax income changes relative to pre-tax changes. We find a relatively high degree of income mobility, with almost half of workers exhibiting earnings increases or decreases of at least 25 percent, and two-fifths of tax units experiencing income changes of this magnitude. Male and female labor income mobility patterns are remarkably similar, though marriage is associated with earnings gains among men, but is associated with modest earnings declines among women. We also observe that large income gains are most likely among families that add workers—either through marriage or through a second family member entering the workforce.
"Income Variability: Effects on U.S. Income Inequality and Tax Progressivity."
Rice University, PhD Dissertation, 2012.
[Abstract]
[1] Income variability explains a significant fraction of the increase in annual income inequality. Using income tax return panel data, I estimate that up to a fifth of the increase in top one percent income shares between the early 1980s and 2000s was caused by variability. Increased income variability over this period resulted from mean-reverting fluctuations in the bottom quintile and top one percent. Variability in the top of the distribution seems partly driven by permanent income shifting in response to the Tax Reform Act of 1986.
[2] Using Social Security Administration earnings panel data, I estimate that variability explains half of the increase in annual inequality in the bottom half of the distribution between 1973 and 1985. When workers with years of zero earnings are included, increasing earnings variability explains almost all of this group's increase in inequality. The increase in earnings variability appears to be explained by an increased fraction of working age men with years of zero earnings.
Annual individual earnings inequality in the bottom half of the distribution not only increased with variability in the 1970s and 1980s, but also fell with variability in the 1950s and early 1960s. This suggests that the U-shaped trend in income inequality observed over these decades was partly caused by first a fall and then a rise in earnings variability. Between 1985 and 2000, falling variability caused most of the decline in annual earnings inequality within the bottom half of the distribution. Within the top of the distribution, earnings inequality increased over this period because of changes in permanent earnings and not increasing variability.
[3] Income variability means that in a progressive tax system annual and lifetime federal
tax rates can diverge. On an annual basis, those at the bottom of the distribution pay little or no federal income taxes, while on a lifetime basis they pay average tax rates about five percentage points higher. Income variability also means there is a trade-off between vertical and horizontal equity.
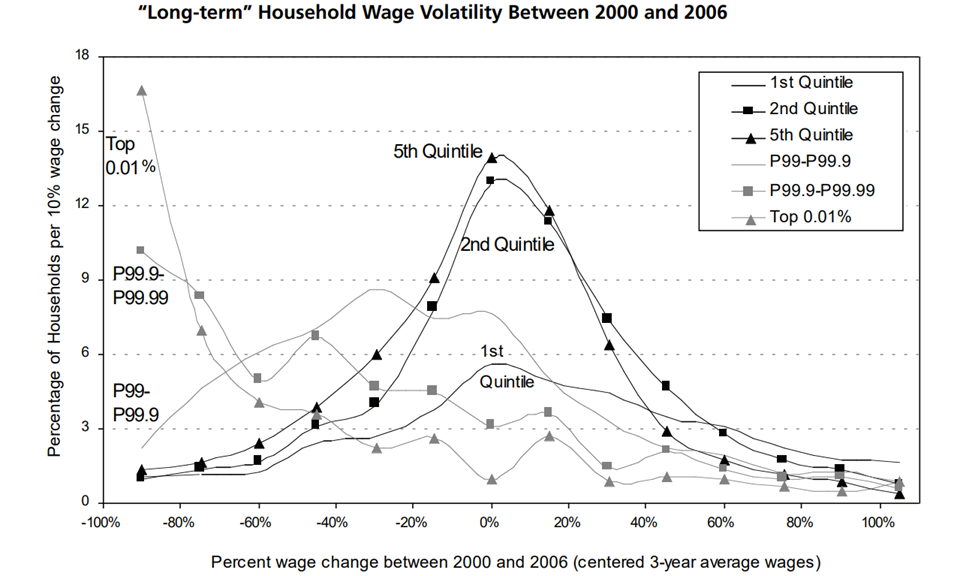
"Income Volatility and Mobility: U.S. Income Tax Data, 1999-2007."
with Victoria Bryant and John Diamond. Proceedings of the 102nd Annual Conference of the National Tax Association, 2009.
[Abstract]
Using a panel of income tax returns from 1999 to 2007, we estimate income volatility and several measures of income mobility. We find that wage volatility looks similar across most of the income distribution, although the bottom quintile and top 1 percent of households have higher wage volatility. For the bottom quintile wage gains are more frequent and persistent, while for the top 1 percent losses are more frequent and persistent. This suggests a reversion to household level mean wages for these households.
Tax Policy: Tax Credits, Deductions, and Behavioral Responses
"Comment: Income Inequality and Campaign Contributions: Evidence from the 1986 Reagan Tax Cut." Working paper, 2026.
[Abstract]
This paper comments on a study by Larcinese and Parmigiani (2026) suggesting that the Tax Reform Act of 1986 disproportionately increased high-income campaign contributions in the United States. Their treatment measure implies large aggregate tax decreases, even though real federal individual income-tax receipts and total federal tax receipts increased. This sign error results from applying statutory marginal tax-rate changes to market income while ignoring tax-base changes and differences between market and taxable income. This comment also argues that real campaign contributions did not surge after the reform, that TRA86 increased measured tax progressivity, and that campaign-contribution patterns following later high-income tax increases contradict the proposed mechanism.
"Advance Tax Credits: Reconciliations and Repayments."
with James Elwell and Lin Xu. National Tax Journal, 2026, 79(1): 73-106. (Excel file)
[Abstract]
Advance tax credits may require recipients to repay excess amounts. Policymakers have limited information about these repayments, their distributional impact, or the cost of repayment protections. We estimate these using tax data across four advance credits: health insurance premium tax credits, child tax credits, earned income tax credits, and stimulus checks. Advance credit repayments usually result from income increases across credit phase outs. Credits targeting lower-income families have phase outs affecting many people with income increases, resulting in higher repayment rates. We discuss how advancing credits can contribute to noncompliance and introduce an approach to evaluate advance tax credit proposals.
"Double-Claimed Dependents: Did E-Filing Lower U.S. Tax Noncompliance?"
with William Gorman and Jamie McGuire. Working paper, 2025. (Excel file)
[Abstract]
Children should only be claimed on a single tax return, but some are claimed on two returns, or double-claimed. While many countries use child registries to prevent double-claiming, the United States tax authority does not. As a result, in 2001 the U.S. had over one million double-claimed dependents. Despite increasing child tax benefit values, however, over the last two decades the annual number of double-claimed dependents in the U.S. decreased by 80 percent.
This paper documents this decrease and suggests it resulted from an increase in electronically filed returns, as double-claiming causes automatic e-file rejections. The decrease in double-claimed dependents avoids over 50,000 annual audits and reduces annual tax credit payments by about $3 billion. Our findings suggest e-filing may have helped lower tax noncompliance more broadly over this period, as the IRS also rejects e-filed returns for many other reasons. Additionally, double-claiming illustrates a consequence of tax complexity, as the rules for dependent claiming are often not straightforward. This analysis is also timely. There have been two recent proposals for U.S. child registries, and the IRS just reversed its longstanding policy by now allowing e-filed double-claiming.
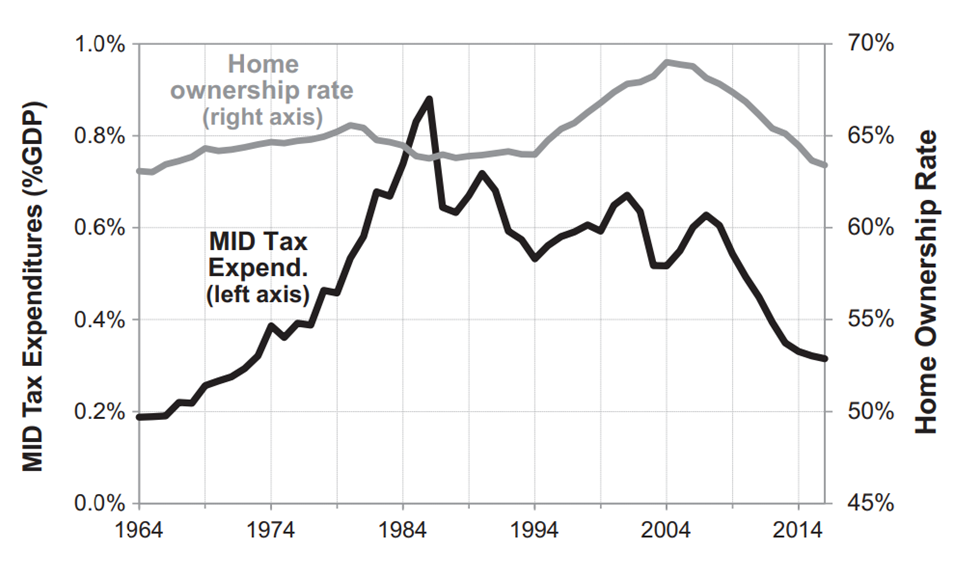
"The Mortgage Interest Deduction: Causes of Fluctuations in a Procyclical Tax Expenditure." Public Finance Review, 2019, 47(5), 807-827. (Online data: Excel)
[Abstract]
The mortgage interest deduction (MID) is the largest source of US federal homeowner support. I estimate that this tax expenditure fluctuated between 0.2 and 0.9 percent of gross domestic product (GDP) over the past five decades. About half of these fluctuations were caused by changes in tax policy, rather than changes in the housing market. Fluctuations in the MID tax expenditure do not tend to move with homeownership rates; instead, they are procyclical, meaning the MID may exacerbate business cycles.
"Whose Child Is This? Shifting of Dependents Among EITC Claimants Within the Same Household." with Jeff Larrimore and Jacob Mortenson, National Tax Journal, 2017, 70(4), 737-758. (working paper)
[Abstract]
Using a panel of household level tax data, we estimate the degree to which dependents are "reassigned" between tax units within the same household, and how these reassignments affect combined tax liabilities. Reassigning dependents reduces combined tax liabilities on average, suggesting some household level coordination. Additionally, when earned income tax credit (EITC) benefits expanded in 2009, reassignments increasingly involved adding a third child to tax returns to claim these new benefits. However, the subgroup reassigning towards three child tax units actually increased total household tax liabilities, suggesting that some tax units may prioritize minimizing their own tax burden or focus on particularly salient aspects of tax policy.
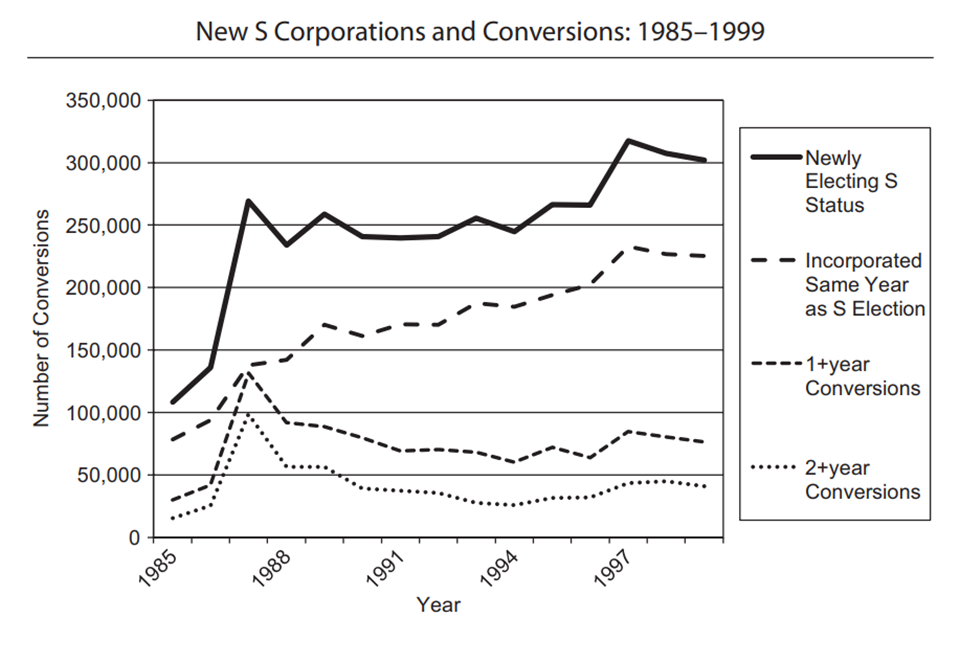
"Reactions of High-Income Taxpayers to Major Tax Reforms."
with Gerald Auten and Susan Nelson, National Tax Journal, 2016, 69(4), 935-964.
[Abstract]
This paper examines how high-income taxpayers reacted to major tax legislation that affected incentives for realizations of capital gains, the form of compensation, type of investments, and the choice of organizational form for businesses. The Tax Reform Act of 1969, the Tax Reform Act of 1986, the Omnibus Budget Reconciliation Act of 1993, and the American Taxpayer Relief Act of 2012 are considered. The paper summarizes prior research and provides new evidence of short-term and longer-term responses of high-income taxpayers. The analysis uses individual and business tax return information to examine some of the most salient features of each of these laws. Examining the responses to prior reforms can inform discussion of the effects of future tax reform proposals.
Health Insurance & Pensions
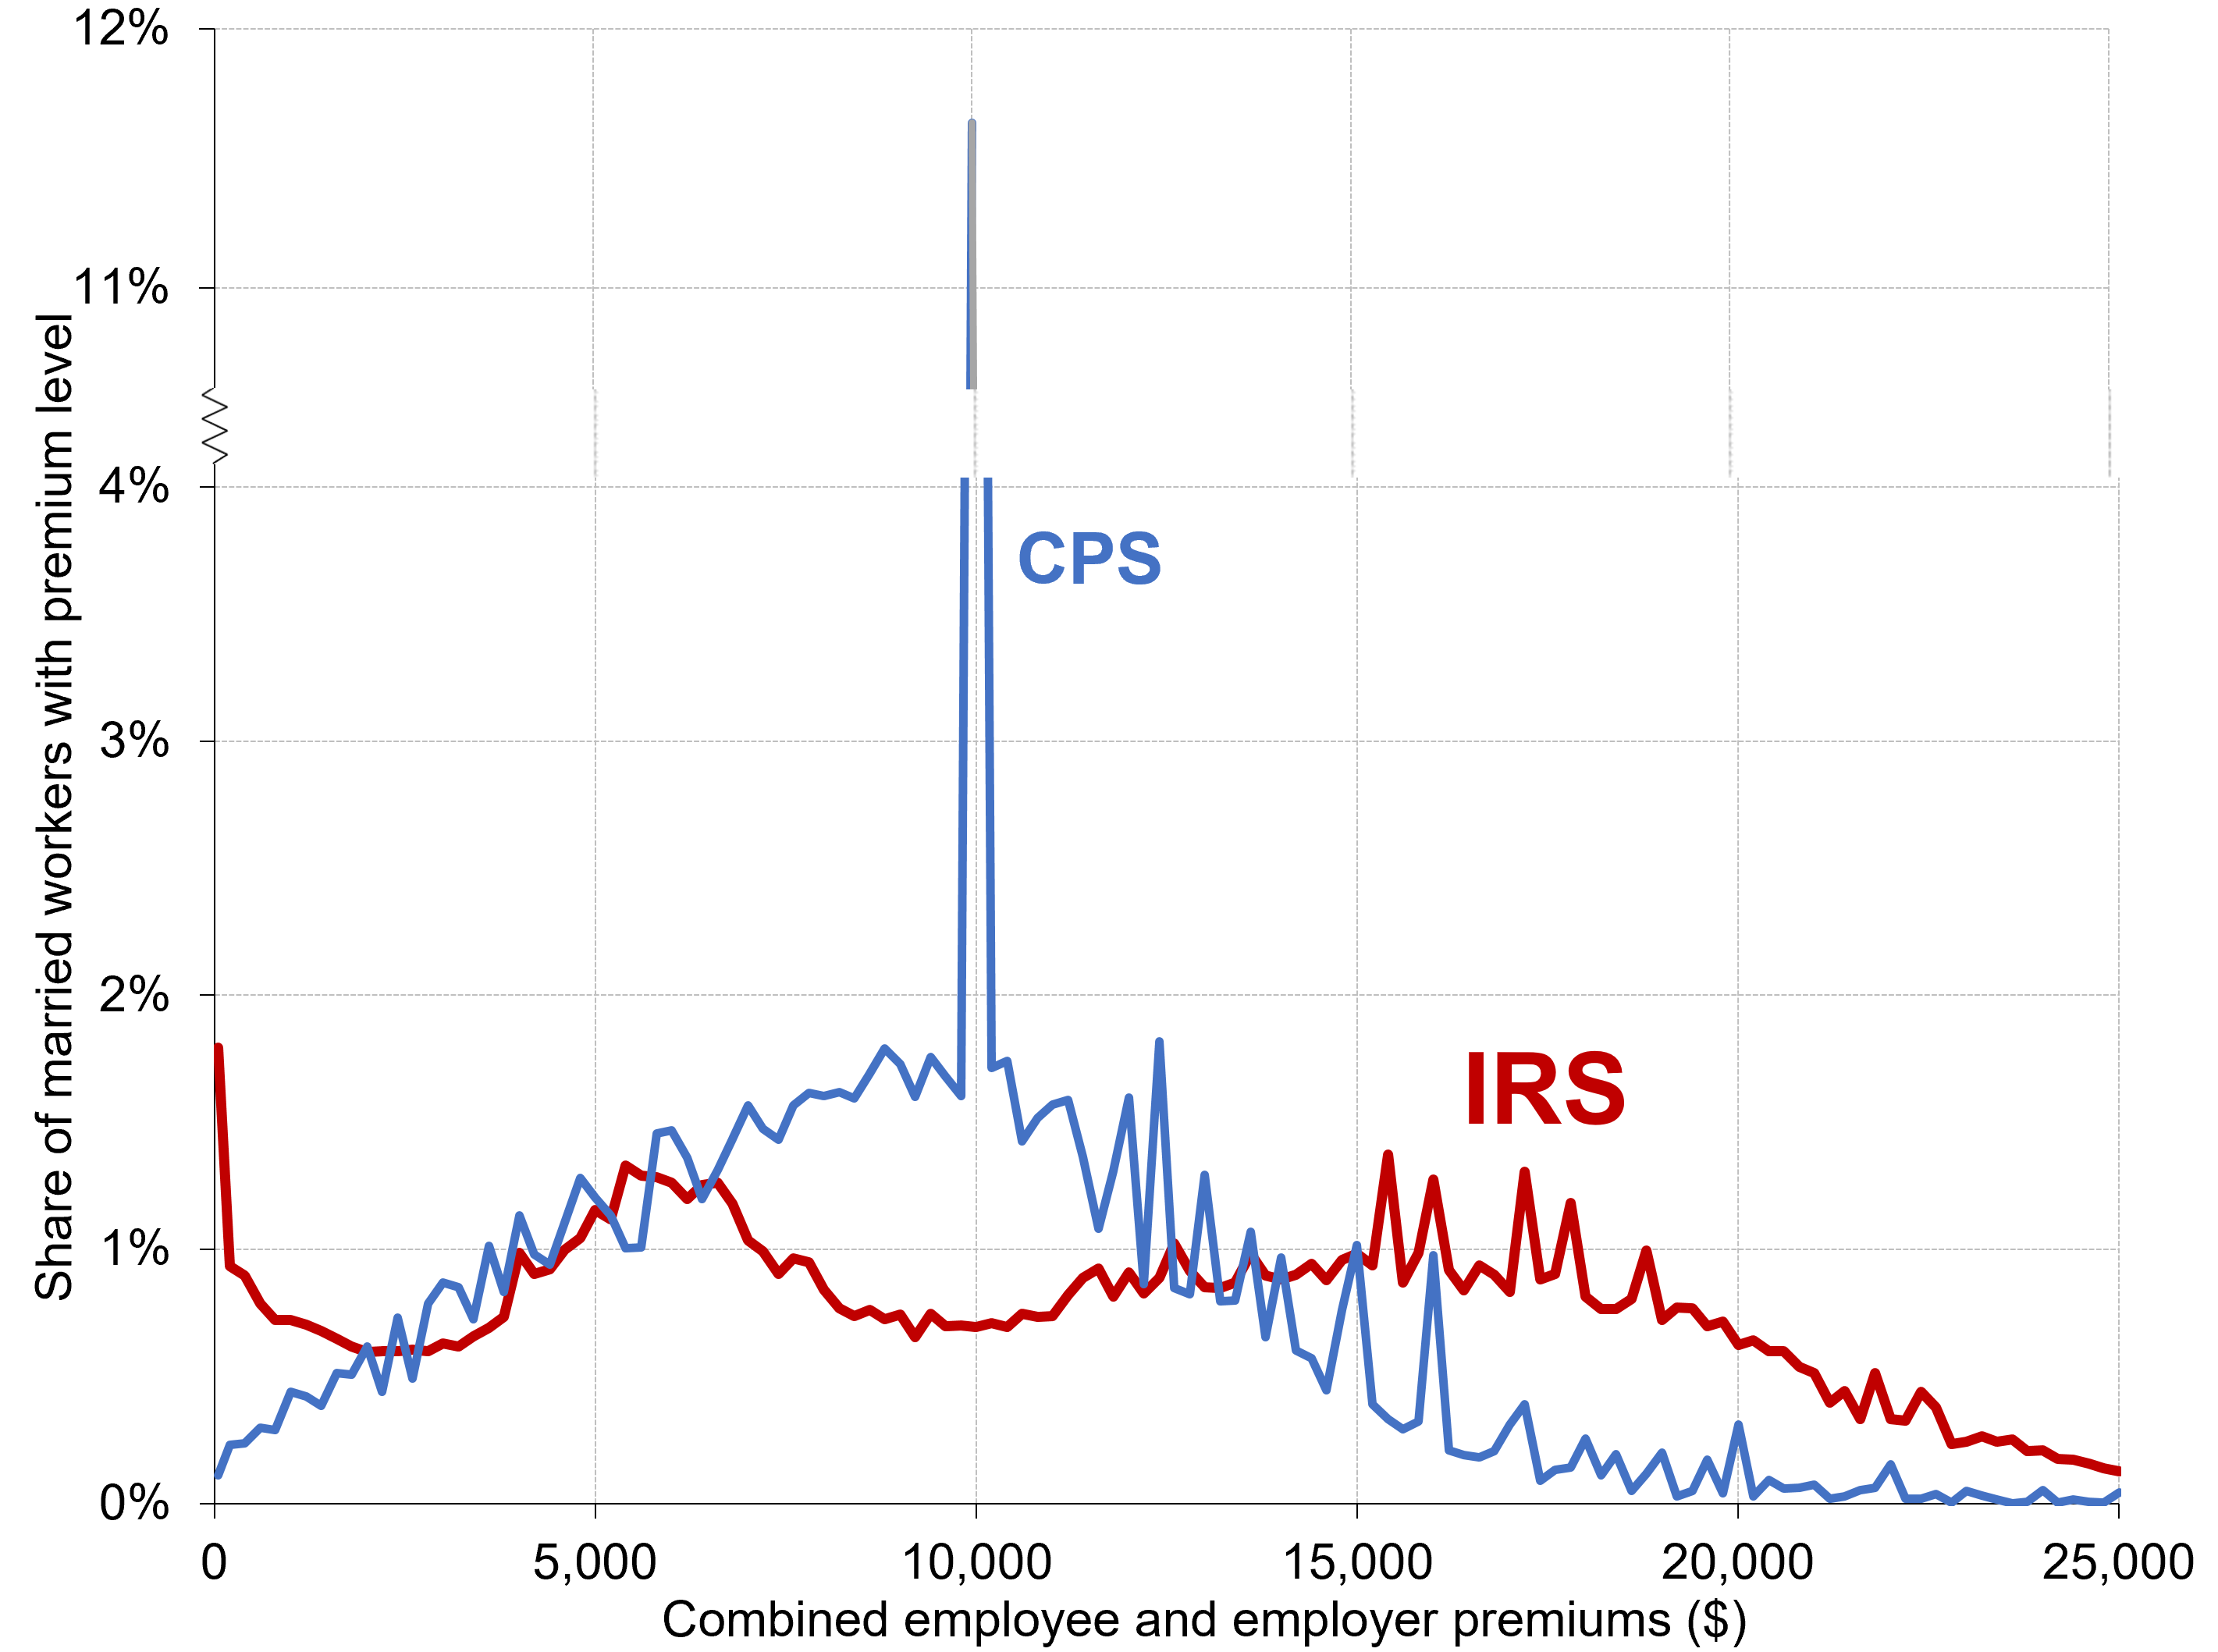
"How Much Does Health Insurance Cost? Comparison of Premiums in Administrative and Survey Data." with Jeff Larrimore. Economics Letters, 2019, 174: 132-135.
(Excel data, working paper)
[Abstract]
Using newly available administrative data from the IRS, this paper studies the distribution of employersponsored health insurance premiums. Previous estimates, in contrast, were almost exclusively from household surveys. After correcting for coverage limitations of IRS data, we find average premiums for employer-sponsored plans are roughly $1,000 higher in IRS records than in the Current Population Survey. The downward bias in the CPS results from underestimating premiums of married workers and topcoding of high premiums.
"State Pension Contributions and Fiscal Stress."
Journal of Pension Finance and Economics, 2017, 16(1), 65-80.
[Abstract]
Fiscal stress pressures state legislators to either raise taxes or cut spending, but public pensions provide a vehicle to postpone tax increases and maintain current spending. I estimate that states cut their pension contributions at seven times the rate of other spending in response to fiscal stress. The cumulative impact of state undercontributions due to fiscal stress explains about 4% of mid-2008 actuarial underfunding. States not paying actuarially required contributions for reasons other than fiscal stress explains an additional quarter of underfunding. As investment returns explain little underfunding, much underfunding appears due to insufficient employee and actuarially required government contributions to keep up with growing pension liabilities.