
Research Areas
New Research
Tax Compliance
Covid Policy
Income Inequality
Tax Progressivity
Income Mobility
Tax Credits/Policy
Health/Pensions
Curriculum Vitae
Google Scholar

The standard narrative on inequality is well-known: the top 1% are pulling away from the rest. A revised narrative shows smaller
increases in market income inequality, and much less increase for incomes after taxes and transfers, due to increasing tax progressivity
and transfers (Auten and Splinter 2024; Burkhauser et al. 2024).
Top 1% Mobility is High
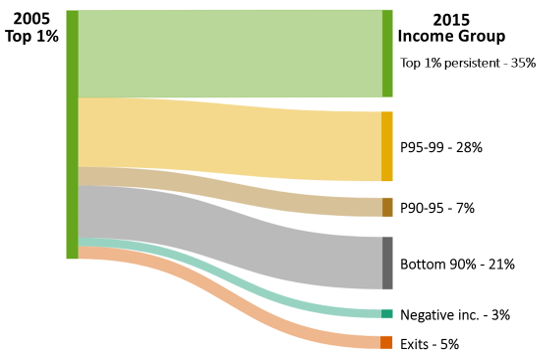
The headline finding is how unstable are top incomes. We find that one-third of people in the top 1% fall out after just one year.
Over more years, turnover is higher. After a decade, two-thirds of those who started in the top 1% are no longer there.
Top 1% Exit Destinations
Multi-Year Inequality is Lower than Annual Inequality
Because people cycle in and out of the top, annual measures of inequality overstate longer-run inequality.
When averaging income over multiple years, top income share fall. For example, averaging over two decades decreases
top-one-percent shares by more than 10%.
It's Entrepreneurs, not Rentiers
Who cycles in and out of the top? The data suggest they are not the idle rich living off stable dividends.
Decomposing the sources of income variability, we find that most of the increase in top 1% income variability originates
from entrepreneurial income. This is driven by passthrough businesses such as S-corporations and partnerships.
What about Wealth?
You might argue that income is volatile, but wealth is persistent. We tackle this by capitalizing income flows to
estimate wealth shares, extending the approach used in Saez and Zucman (2016) and Smith et al. (2023) by using panel data.
This shows that variability also matters for estimating wealth.
Implications
Fairness
Bottom line
The top one percent is an ever-changing group, with people cycling in and out each year.
The rich are different from you and me — their incomes are much more volatile. The top 1% is, in Schumpeter's famous phrase,
a hotel that is "always full, but always of different people."
References
Income Mobility of the Top One Percent (summary)
January 2026 (pdf version)
Still, both the standard and revised narratives rely on "snapshot" data — cross-sections that only see incomes in a single year.
But what if we instead consider incomes over time?
In Splinter and Larrimore (2026), we use tax data to track the same people over time. The findings challenge the view of a static elite.
Exit rates are even higher for the very rich. For the top 0.1%, three-quarters are gone after a decade. For the top 0.001%,
four-fifths fall out of that highest group. These estimates support Pareto's old idea of the "circulation of elites."
This high degree of mobility distinguishes the U.S. from other countries. Annual top 1% exit rates in the U.S. of up to 40%
(Auten, Gee, and Turner 2013) are higher than in Germany (23%), the UK (26%), Australia (27%), or Canada (30%).
The American rich are richer, but they are also less stable in their position.
Where do individuals falling out of the top 1% end up? Among those in the top 1% in 2005, about one-third fall to the bottom 90%
ten years later, as seen in the figure.
The effect is larger as one moves up the distribution:
● The top 0.1% share decreases by about 20%
● The top 0.01% share decreases by about 30%
● The top 0.001% share decreases by about 40%
This implies that part of what we measure as "inequality" is actually "income variability." An owner sells a firm,
a worker exercises options, or an investor realizes large capital gains. Their income spikes for a year — pushing
them into the top 1% or even top 0.001% — but then recedes. This also affects inequality trends. Over the last quarter century,
about one-fifth of the growth in the top 1% share is due to variability.
Unlike Piketty's account of European rentiers in past centuries, today's top U.S. earners are often business owners with
volatile incomes. Variability in capital income (dividends and interest) has declined, partially offsetting the larger swings
in entrepreneurial income.
Compared to annual measures, averaging capital incomes over two decades lowers the top 1% wealth share by about 3 percentage points.
This is a smaller relative reduction than for income — about a 9% decrease in the top wealth share —
but it suggests that even wealth concentration is somewhat overstated by standard annual measures.
A society where the top 1% consists of the same individuals every year is fundamentally different from one where many cycle through.
The high U.S. churn rate suggests that while the top 1% threshold is high relative to other countries, the degree of mobility is
also higher.
Hirschl and Rank (2015) estimate that 11% of working-age adults spend at least one year in the top 1% and over half spend at least
one year in the top 10%. This circulation is even more pronounced at the very top of the distribution. The median tenure in the top
400 was only a single year (IRS 2016).
Multi-Year Measures
This paper reinforces that annual data can present a biased view of longer-run inequality measures. This is not just an issue
for the top, but also the bottom of the distribution, where increased income variability can explain a large share of the
growth in overall inequality (Splinter 2022). And, as we found in earlier work,
(Larrimore, Mortenson, and Splinter 2022),
over 40% of those in poverty in a given year rise out of poverty the next year.
Inequality Levels and Trends
Mobility matters for interpreting both income inequality levels and trends. Variability reduces top 1% shares by over one-tenth
and explains one-fifth of its recent increase.
Read the full paper here (pdf).